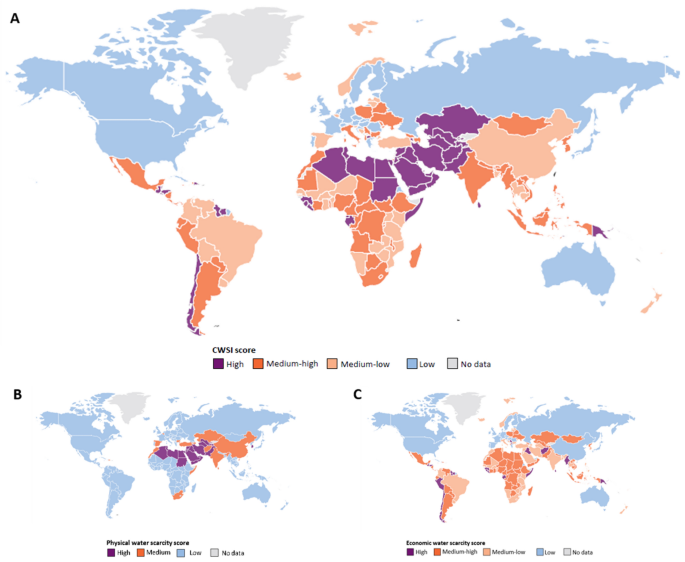
Trade of economically and physically scarce virtual water in the global food network The virtual water (VW) trade associated to food is composed by the quantity of water utilized for the production of the crops exchanged on the global market. In assessing a country’s water abundance or scarcity when entering the international VW trade, scholars consider only physical water availability, neglecting economic water scarcity, which indicates situations in which socio-economic obstacles impede the productive use of water. We weight the global VW trade associated to primary crops with a newly proposed composite water scarcity index (CWSI) that combines physical and economic water scarcity. 39% of VW volumes is exported from countries with a higher CWSI than the one of the destination country. Such unfair routes occur both from low- to high-income countries and among low- and middle-income countries themselves. High-income countries have a predominant role in import of CWSI-weighted VW, while low- and middle-income countries dominate among the largest CWSI-weighted VW exporters. For many of them economic water scarcity dominates over physical scarcity. The application of the CWSI elicits also a status change from net exporter to net importer for some wealthy countries and viceversa for some low- and middle-income countries. The application of CWSI allows one to quantify to what extent VW exchanges flow along environmentally and economically unfair routes, and it can inform the design of compensation policies. Virtual water trade is constituted by the volume of water that is consumed for the production of goods that are subsequently traded on the international market1,2,3,4. The trade of agricultural products accounts for about 90% of the total virtual water (VW) displaced for human consumption5. The VW associated to traded food at the global level is approximately 25% of the total amount of water utilized for agriculture5, and it has doubled from 1986 to 20076. Moreover, from the 1990s to 2015 the quantity of food exchanged on international markets has increased almost three times faster than food production7.Along with increased globalization and higher importance of long value-chains in the food domain, the economic and environmental system tends more and more to a detachment between places of production and consumption4,8 and to an increased countries’ vulnerability5,9,10,11,12. Through the outflow of virtual water embedded in food exports, countries renounce to precious domestic water resources, while through the inflow of VW included in food imports, countries benefit of water belonging to other areas of the world2,4,12.Beside the reconstruction and the analysis of the structure of the VW network worldwide6,13, scholars have analyzed the global VW dynamics mainly according to two viewpoints. In the first one, authors address the question on whether VW trade compensates or not for lack of available resources (including water and land) for food production in given countries or areas14,15,16. Many scholars find evidence that VW trade alleviates pressure on several water stressed regions, which are allowed to import and consume food that has been produced in other world regions where water is more abundant1,14,17,18,19,20. On the other hand, other authors identify some paradoxes since some water-scarce countries or areas actually are net VW exporters, and vice versa21,22,23,24,25. A second group of scholars focuses on whether VW fluxes associated to agricultural products are ‘sustainable’ from an environmental point of view, providing different estimates of water stress due to VW trade18,26,27,28,29,30,31,32,33. However, only physical water availability is typically considered in both viewpoints when the water endowment of a country is assessed, i.e. its ‘starting line’ in the scene of international virtual water trade17.If sufficient physical availability of renewable water resources is the crucial pillar of productive water use34,35,36,37,38,39, the second pillar is represented by an infrastructural, economic and institutional environment that allows water access and use40,41,42. The lack of possibilities for water utilization due to social, economic and institutional factors is labeled by many scholars as economic water scarcity43,44,45. For example, in countries such as Congo DR and Cambodia water stress is low according to hydrological parameters, but indicators on water use efficiency or agricultural performance depict a critical situation, leading to the intuition that the utilization of available water is far from effective46,47,48. In some Central Asian countries, such as Afghanistan or Kazakhstan, disinvestment in irrigation infrastructures led to waste of water resources and to economic losses in agriculture, although the physical pressure on hydrological resources is comparatively low49. Therefore, underinvestment in water institutions and infrastructures and weak water governance processes usually seriously prevent a proficient water use in different sectors and in particular in agriculture. According to some estimates, about 1.2 billion people live in zones of physical water scarcity, while another 1.6 billion people is located in areas of economic water scarcity. Moreover, low-income households tend to suffer more from consequences of economic water scarcity49, p. 48. The notion of economic water scarcity has been studied by both international organizations50,51 and academic scholars44,45,52, in order to reflect on common definitions and to design appropriate indicators for its measurement and quantification31,52,53. The aim has been to consider organizational issues, political accountability, infrastructure and institutions for water access, beside physical water availability. This investigation overlapped with other streams of research that addressed the same issue from slightly different angles. Scholars working on the water poverty concept aimed at combining information on estimates of water presence in a country or area with variables that reflects socio-economic poverty43,52,54. Other authors worked extensively on multidimensional water security, combining indexes on water availability, accessibility, safety and management41,42,52,55. The discipline of socio-hydrology addresses the interaction between the dynamics of hydrological resources and of social human processes in order to study water systems and to estimate associated risks40. Due to the inherent complexity of the phenomenon of economic water scarcity, its measurement is particularly challenging and only recently attempts have been made to quantify this dimension and to estimate its impact on agricultural performance following data-driven approaches53,56.Within this picture, in the present paper, we reassess the VW volumes associated to the international trade of primary crops under the lens of both physical and economical water scarcity of the country of origin. We argue that it is appropriate to consider economic water scarcity (EWS) in the context of trade because EWS, exactly as physical water scarcity, is a feature that characterizes the country in which the traded crop is cultivated, e.g. one of the endowments of the factors of production of a country. Through the virtual water inflow from areas with high water scarcity, importing countries compete with the local population for the use of the hydrological resources that are physically and economically available in the producing country.As we will explain more in detail in Sect. 2 and in the Data and Method section, we consider the volumes of green and blue water that are used in each country for the cultivation of the primary crops that are traded internationally. We consider 2016 since it is the last year for the availability of virtual water data from the CWASI database46. We weight those volumes with an index that reflects, for the respective country, the lack of available water (physical water scarcity) and the lack of management and governance practices that improve economic and infrastructural access to hydrological resources (economic water scarcity). This weighting methodology has been utilized by Lenzen et al.27 who, however, apply only the physical water scarcity weight, while we apply a composite water scarcity weight that includes also economic water scarcity. As27 underline, we utilize water scarcity information only as an input into a weighting procedure, in order to convey the message that the virtual water associated to traded food has been used in countries facing different degrees of water scarcity, due to either physical or socio-economic causes, or both.For the first time, to the best of our knowledge, a novel viewpoint for the consideration of water scarcity is adopted. We provide a quantitative measure of the VW flows that are considered scarce under this new perspective and an assessment of the changes that this new metric produces in the role of the countries in the international VW trade, also in relation to their economic wealth.We build a composite index of physical and economic water scarcity. In order to account for the physical water scarcity (PWS), we utilize the indicator of hydrological pressure that quantifies the percentage of freshwater withdrawal over the total renewable water resources in a country (see Supplementary Table S4). This indicator is provided by ACQUASTAT47, it has already been utilized by Lenzen et al.27 and discussed in different reviews, including41,52. It is therefore a used and well acknowledged indicator52, and it is of immediate understanding. For this index, zero is associated to absence of pressure, while 1 denotes maximum pressure. For the quantification of economic water scarcity we use the SDG indicator 6.5.1 on Integrated Water Resource Management—IWRM, (see Supplementary Table S4)57. The indicator reflects different dimensions of water governance and management, providing a framework to assess whether, in a given country, water resources are managed in an equitable, efficient, and sustainable mode. It is based on a set of questions organized in four pillars posed to country representatives: enabling environment, institutions and participation, management instruments and financing57. The adequacy of this indicator for the measurement of economic water scarcity has been assessed in53,58,59,60 Vallino et al.53, and UN Environment57 estimated also that the indicator brings along new information with respect to the most common measures of socio-economic development of a country, such as the Gross Domestic Product per capita and the Human Development Index (see also52). The IWRM is close to zero when low levels of water management are present (i.e., economic water scarcity is maximum) and to 1 when best water management is attained (i.e., economic water scarcity is absent). Both indicators cover 90% of the countries of the world and approximately 99% of the world population (see Supplementary Table S4). Different scholars provided valuable reflections on the strengths and challenges of both indicators27,41,52,53,58,59,60, as we discuss in the Data and Method section. The composite water scarcity index (CWSI) that we propose, ranging 0–1, is constructed as$$ CWSI = 1 – IWRMleft( {1 – PWS} right) $$where PWS is the physical water scarcity measured through the above-mentioned index of hydrological pressure. The CWSI is equal to 1 when scarcity is at the maximum level, and this occurs when either the physical scarcity or the economic scarcity attain the maximum stage (i.e., IWRM = 0 or PWS = 1). Conversely, it is closer to zero when both the economic scarcity and the physical scarcity are low (i.e., IWRM = 1 and PWS = 0) (see Supplementary Table S4). Figure 1A shows the distribution of the CWSI in the world in 2017, which is the last year when the IWRM is available57. The highest values, denoting highest composite water scarcity, are concentrated in the MENA region and in Central Asia, with hot-spots also in Central and South America. The lowest values are mainly located in high-income countries, with some exceptions, such as Italy and some countries in East and South-East Europe which present relatively critical levels of economic water scarcity despite belonging to the high-income group. Norway and Iceland are examples of water abundant countries but have a level of water management that is not best according to the IWRM indicator, while Spain suffers from water scarcity mainly from a physical point of view, having conversely a high level of water management. Many countries, such as Congo DR, Chile and Myanmar, have high water availability, but their low level of water management leads to a high value of the composite scarcity index, denoting a critical situation that would have been overlooked if the dimension of economic scarcity had not been included. Figure 1B, C show the physical water scarcity index and the economic water scarcity index, respectively, where the latter is computed as 1-IWRM. In Fig. 2 we observe that there is not a significant correlation between the indexes of physical and economic scarcity, as assessed, among others, by Damkjaer and Taylor52, therefore our CWSI index brings along and condense new significant information.Figure 1(A) Composite water scarcity index (CWSI) in 2017. Low, medium–low, medium–high and high scores correspond to intervals (0, 0.35), (0.35, 0.55), (0.55, 0.75), and (0.75, 1), respectively. (B) Physical water scarcity index in 2017. Low, medium, and high scores correspond to intervals (0, 0.2), (0.2, 0.4), and (0.4, 1), respectively. Thresholds are retrieved from the scientific literature[52,60,61,62]. (C) Economic water scarcity index in 2017. Low, medium–low, medium–high and high scores correspond to intervals (0, 0.30), (0.30, 0.50), (0.50, 0.70), and (0.70, 1), respectively. Thresholds are retrieved from the official documents related to the IWRM index57. The map was generated with D3.js (authors elaboration; https://d3js.org Version 4.13.0).Figure 2Physical water scarcity (hydrological pressure) and economic water scarcity (1 − IWRM) for 149 countries (2017). The size of the point is proportional to the total volumes of VW involved in both export and import for that country (m3). Green points indicate net importer countries (having VW import associated to food higher than export), while violet points indicate net exporter countries (having VW export higher than import). The ISO codes correspond to the following countries. BRA Brazil. USA United States of America. CHN China. IND: India. ARE United Arab Emirates.Virtual water flows between countries with large difference in composite scarcityWe aim at assessing the VW trade associat
https://www.nature.com/articles/s41598-021-01514-w
Trade of economically and physically scarce virtual water in the global food network