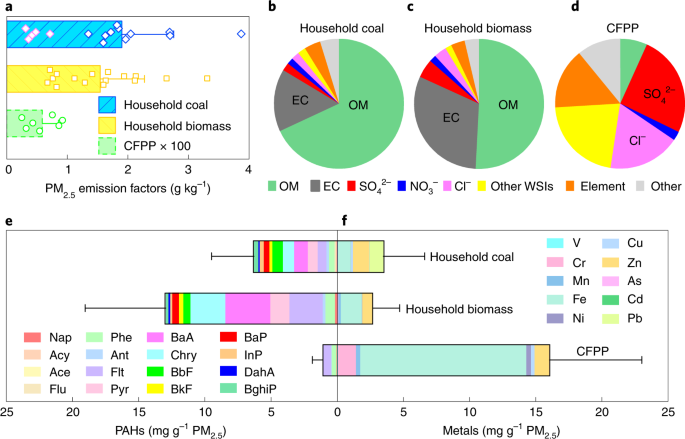
Toxic potency-adjusted control of air pollution for solid fuel combustion Di Wu1 na1, Haotian Zheng orcid.org/0000-0001-6816-15972,3 na1, Qing Li orcid.org/0000-0003-0587-17481, Ling Jin orcid.org/0000-0003-1267-73964,5, Rui Lyu1, Xiang Ding1, Yaoqiang Huo1, Bin Zhao2, Jingkun Jiang2, Jianmin Chen orcid.org/0000-0001-5859-30701, Xiangdong Li orcid.org/0000-0002-4044-28884 & Shuxiao Wang orcid.org/0000-0001-9727-19632,3 Nature Energy (2022)Cite this article CoalEnergy policyEnvironmental impactEnvironmental studies The combustion of solid fuels, including coal and biomass, is a main anthropogenic source of atmospheric particulate matter (PM). The hidden costs have been underestimated due to lack of consideration of the toxicity of PM. Here we report the unequal toxicity of inhalable PM emitted from energy use in the residential sector and coal-fired power plants (CFPPs). The incomplete burning of solid fuels in household stoves generates much higher concentrations of carbonaceous matter, resulting in more than one order of magnitude greater toxicity than that from CFPPs. When compared with CFPPs, the residential sector consumed only a tenth of solid fuels in mainland China in 2017, but it contributed about 200-fold higher of the population-weighted toxic potency-adjusted PM2.5 exposure risk. We suggest that PM2.5-related toxicity should be considered when making air pollution emission control strategies, and incomplete combustion sources should receive more policy attention to reduce exposure risks. The combustion of solid fuels has been recognized as the main anthropogenic emission source of particulate matter (PM) that elicits adverse effects on air quality and human health1,2,3,4. Solid fuels, including coal and biomass, have been widely used for direct energy usage in industrial and residential sectors worldwide5,6. As one of the largest consumers of solid fuels, the industrial sector and particularly coal-fired power plants (CFPPs) have received far more attention. PM emissions from CFPPs has greatly decreased in the past few decades in many regions due to phasing out old units, the upgraded emission control technology and strengthening policies enforcement7,8,9. In contrast, the residential sector (including household coal and biomass combustion), as the largest source category of global PM2.5 emissions10,11, has been neglected for a long time. Residential solid fuel combustion has caused severe air pollution12,13, which has contributed to 31% to the total premature deaths worldwide and can be even worse in developing countries4,14,15,16,17.Toxic potency (the relative concentrations of different chemicals or particulate samples to reach the same level of effect on a given biological endpoint) of source-specific PM per unit mass is an important metric along with mass emission in weighing the exposure risks between emission sources18. PM2.5 (PM with an aerodynamic diameter less than 2.5 µm) emitted from industrial boilers and residential stoves varies widely owing to the large discrepancies in real-world combustion practices and after-treatment control levels19,20,21,22. The PM-related toxic potency, which is shaped by multiple combinations of chemical compositions, may be disparate between the residential sector and CFPPs. The harmful effects resulting from solid fuel combustion have not been fully revealed and are overlooked, especially in the residential sector, without considering aerosol-related toxicity. Substantial knowledge gaps exist relating to how mixtures of chemical constituents, particularly toxic components contained in PM, trigger the overall toxicity23. The lack of PM-related toxicity data from real-world combustion limits the current understanding of PM exposure and the devising of air pollution control strategies.This study proposes toxic potency-adjusted control of air pollution via considering toxicities of source-oriented PM, taking solid fuel combustion in the residential and power plant sectors as an example. The unequal toxicities, including estimations of oxidative stress and cytotoxicity of PM, are revealed through field studies and laboratory analysis. Field measurements of residential combustion are conducted in northern and southern China, while field studies of typical units of CFPPs are conducted in northern and eastern China. The quantitative assessment of PM toxicities, based on the developed air benefit and cost and attainment assessment system (ABaCAS) emission inventory and the weather research and forecasting model-community multiscale air quality (WRF-CMAQ) model, provides further insight into revealing hidden risks from source-oriented PM and devising air pollution emission control strategies. Field measurements and analytical approaches are detailed in Methods and Supplementary Note.The emission factors (EFs) (the quantity of pollutants released to the ambient air per unit of fuel combusted) of PM2.5 from household combustion are approximately 264 to 324 times higher than those from CFPPs that meet the strictest ultralow emission (ULE) standards in China (Fig. 1a). The PM2.5 EFs for household coal combustion were estimated with weighting factors for coal consumption (Supplementary Note 7). The observed PM2.5 EFs from residential combustion are consistent with those reported in previous studies19,20,24,25, including the PM2.5 EFs obtained from nationwide field emission measurements conducted in rural China recently26. Additionally, the obtained PM2.5 EFs for CFPPs are consistent with those reported in continuous emissions monitoring systems (the real-time measurements of PM emission concentration at CFPP stacks nationwide), which had installed in over 95% of China’s power capacity by 2017 (refs.7,27). The large discrepancy of PM2.5 EFs between the residential and power plant sectors is consistent with previous studies20,24,25. The relative distributions of chemical constituents of PM2.5 demonstrate large differences between residential stoves and CFPPs (Fig. 1b–d). Owing to the low combustion efficiency of residential solid fuel burning, carbonaceous species including organic matter and elemental carbon form the main components of residential PM2.5, comprising 83.1 ± 6.5% of the total PM2.5 emitted from household stoves. The mass fractions of organic matter and elemental carbon contained in PM2.5 are 37.4–85.6% and 7.8–44.0% for household burning emissions, respectively, while inorganic constituents (that is, sulfate, nitrate, chloride and elements) are minor fractions of household PM2.5. In contrast, CFPP-emitted PM2.5 is dominated by inorganic species (that is, water-soluble ions (WSIs) and elements), which account for 82.3 ± 10.9% of the total PM2.5 mass concentration, while carbonaceous species contribute only 6.7 ± 4.1% to the total PM2.5. Sulfate and chloride are the dominant ions, responsible for 25.4 ± 11.9% and 17.9 ± 5.7% of the total CFPPs PM2.5, respectively. The observed compositions of PM2.5 from residential combustion and CFPPs are both consistent with those reported in previous studies (Supplementary Table 1). Carbonaceous materials dominate PM2.5 emitted from the residential combustion, while inorganic species are the main component of CFPPs PM2.5. Among these chemical species, only minor fractions of these carbonaceous materials and inorganic species (for example, polycyclic aromatic hydrocarbons (PAHs) and metals) are often targeted and regarded as key contributors to negative health effects.28,29Fig. 1: Real-world PM2.5 emission profiles.a, PM2.5 EFs for the residential sector and CFPPs. The coloured points (yellow squares and green circles) are the measured EFs of individual samples, while the red and blue diamond patterns represent anthracite and bituminous coals, respectively. Data are presented as mean values ± s.d. b–d, Relative mass distributions of PM2.5 emitted from household coal combustion (b), household biomass combustion (c) and CFPP (d). Organic matter (OM) is estimated as organic carbon (OC) × 1.2; the elements include Al, Ca, K, Mg, Na, P, S, Si, Li, Be, Sc, Ti, V, Cr, Mn, Fe, Co, Ni, Cu, Zn, Ga, Ge, As, Se, Rb, Sr, Mo, Pd, Ag, Cd, Sn, Sb, Cs, Ba, Pt, Au, Ti and Pb; and other WSIs include Li+, Na+, NH4+, K+, Mg2+, Ca2+, F−, Br− and PO43−. EC, elemental carbon. e,f, The mass concentrations of 16 PAHs per unit mass of PM2.5 samples (e) and 10 toxic metals (f) (that is, V, Cr, Mn, Fe, Ni, Cu, Zn, As, Cd and Pb) per unit mass of PM2.5 samples; data are presented as mean values ± s.d. See Supplementary Table 2 for the PAHs and their abbreviations.Source dataThere are large discrepancies in the emissions of 16 PM2.5-bound PAHs between the residential sector and CFPPs equipped with advanced emission controls (Fig. 1e). The EFs of 16 PAHs of per unit mass of PM2.5 emitted from burning coal (6.29 ± 3.20 mg g−1) and biomass (13.0 ± 6.1 mg g−1) in domestic stoves are much higher than those of the PAHs emitted from CFPPs (1.08 ± 0.79 mg g−1). Compared with the PM2.5-bound PAHs from CFPPs, the residential sector-emitted PAHs are much more abundant in high-toxicity-potency PAHs (TEF greater than or equal to 0.1), together contributing 39.0–45.9% of the total PAHs (Supplementary Fig. 1a). In contrast, the EFs of ten priority toxic metals (that is, V, Cr, Mn, Fe, Ni, Cu, Zn, As, Cd and Pb) per unit mass of PM2.5 emitted from CFPPs (16.0 ± 7.0 mg g−1) are greater than those of metals emitted from burning coal (3.49 ± 3.12 mg g−1) and biomass (2.75 ± 2.04 mg g−1) in domestic stoves (Fig. 1f). The relative proportions of these metals in CFPP-emitted PM2.5 exceeds that in PM2.5 emitted from residential solid fuel combustion by roughly 4.6–5.8-fold with a large discrepancy (Supplementary Fig. 1b), mainly due to the different metal contents of the solid fuels30. However, the fuel-based EFs of the targeted metals from the residential sector are more than 40 times higher than those from CFPPs, while the fuel-based EFs of the 16 PAHs are more than three orders of magnitude higher for the residential solid fuel combustion than for CFPPs.Unequal toxicity of emitted PM2.5 Figure 2a,b shows the corresponding benzo(a)pyrene (BaP)-equivalent carcinogenic potency (BaPeq) values of the total 16 PAHs and the Cr-equivalent carcinogenic potency (Creq) values of the ten toxic metals, respectively (Supplementary Tables 2 and 3). The EFs of BaPeq per unit mass PM2.5 emitted from household coal (0.78 ± 0.44 mg g−1) and biomass (1.12 ± 0.53 mg g−1) combustion are significantly (P = 2 × 10⁻⁶) higher than those emitted from CFPPs (1.41 ± 0.88 μg g−1), exceeding the latter values by roughly 553- and 794-fold, respectively. High-toxic potency species, including BaP, benzo(a)anthracene and dibenzo(a,h)anthracene, dominated the BaPeq content in the residential sector, accounting for 83.5–87.9% of the total BaPeq. In the CFPP-emitted PM2.5 samples, the top three species (that is, fluoranthene, phenanthrene and anthracene) contributing to BaPeq, together making up roughly 95.0% of the total BaPeq, are less toxic species. Owing to the significantly (P = 1 × 10⁻⁵) higher EFs of primary PM and PM-bound high-toxic potency PAHs from the residential sector, the fuel-based EFs of BaPeq for the residential sectors are approximately five orders of magnitude higher than those for CFPPs. These results indicate that exposure to household combustion-generated PM2.5 has much higher carcinogenic potency. The EFs of Creq per unit mass PM2.5 emitted from CFPPs (1.36 ± 0.78 mg g−1) are one order of magnitude higher than those emitted from the residential sector. In contrast, the fuel-based total Creq values for the residential sector are 7 to 16 times higher per unit mass of solid fuel than those for CFPPs. These estimated BaPeq and Creq values may have additional uncertainties because the interactions among individual species have been ignored. Owing to the large variation in chemical components, especially hazardous species between residential and CFPP-emitted PM2.5, the chemical-specific toxicity of PM2.5 emitted from residential stoves and CFPPs needs to be examined and quantified.Fig. 2: Unequal toxicity of primary PM2.5 emitted from solid fuel combustion.a,b, Toxic equivalent carcinogenic potency of PAHs (BaPeq) (a) and toxic metals (Creq) (b) per unit mass of PM2.5 samples in household coal (HC), household biomass (HB) combustion and CFPPs. ‘Other’ includes Nap, Ace, Acy, Flu, Phe, Ant, Flt, Pyr, Chry and BghiP (with toxic equivalence factors <0.1). c,d, EC1.5 (c) and IC20 (d) of PM2.5 samples emitted from the residential sector and CFPPs; their values decrease with increasing toxicity. OS, oxidative stress and CT, cytotoxicity. The coloured points correspond to the toxicity of individual samples, while the cyan and blue diamond patterns represent anthracite and bituminous coals, respectively. Data are presented as mean values ± s.d.Source dataA significant inequality is exhibited in toxic potencies of primary PM2.5 emitted from residential sectors and CFPPs, including the oxidative stress (P = 1 × 10⁻¹⁵) and cytotoxicity (P = 6 × 10⁻¹⁶) (Fig. 2c,d). The endpoints of triggered reactive oxidative species (ROS) generation and cell viability in human lung cell lines (A549) are reported as EC1.5 (the effect concentration resulting in a 1.5-fold induction of intracellular ROS generation) and IC20 (the inhibitory concentration resulting in 20% of cell viability decline) values. The PM2.5 toxicity increased with decreasing EC1.5 and IC20 values. The PM2.5 EC1.5 values for household coal and biomass combustion are 8.1 ± 3.0 and 3.7 ± 2.3 μg ml−1, respectively, which are nearly one order of magnitude higher than that for PM2.5 emitted from CF
https://www.nature.com/articles/s41560-021-00951-1
Toxic potency-adjusted control of air pollution for solid fuel combustion