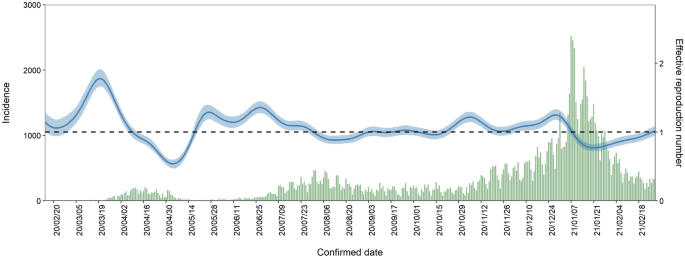
The impact of temperature on the transmissibility potential and virulence of COVID-19 in Tokyo, Japan Assessing the impact of temperature on COVID-19 epidemiology is critical for implementing non-pharmaceutical interventions. However, few studies have accounted for the nature of contagious diseases, i.e., their dependent happenings. We aimed to quantify the impact of temperature on the transmissibility and virulence of COVID-19 in Tokyo, Japan, employing two epidemiological measurements of transmissibility and severity: the effective reproduction number ((R_{t})) and case fatality risk (CFR). We estimated the (R_{t}) and time-delay adjusted CFR and to subsequently assess the nonlinear and delayed effect of temperature on (R_{t}) and time-delay adjusted CFR. For (R_{t}) at low temperatures, the cumulative relative risk (RR) at the first temperature percentile (3.3 °C) was 1.3 (95% confidence interval (CI): 1.1–1.7). As for the virulence to humans, moderate cold temperatures were associated with higher CFR, and CFR also increased as the temperature rose. The cumulative RR at the 10th and 99th percentiles of temperature (5.8 °C and 30.8 °C) for CFR were 3.5 (95% CI: 1.3–10.0) and 6.4 (95% CI: 4.1–10.1). Our results suggest the importance to take precautions to avoid infection in both cold and warm seasons to avoid severe cases of COVID-19. The results and our proposed approach will also help in assessing the possible seasonal course of COVID-19 in the future. The COVID-19 pandemic has imposed significant health and economic burdens all over the world1. A better understanding of the factors affecting the COVID-19 epidemic is critical to the design of tailored public health and social measures (PHSMs), e.g., travel restrictions, school closures, cancellation of public events and gatherings, etc. and much attention has been given to the impact of meteorological factors on the COVID-19 transmissibility and severity.Over the last couple of decades, essential factors related to the transmission of viral respiratory diseases have been investigated such as the highly predictable seasonal pattern of influenza epidemics2. These epidemiological studies are supported by laboratory evidence that low temperature and/or humidity improve the stability of influenza virus3, impair the human innate immune system4 and contribute to the aerosol evaporation5,6.Since the COVID-19 pandemic hit, many research groups worldwide have aimed to reveal the relationships between temperature and COVID-19 transmission. Previous studies examined the hypothesis that high temperature, humidity, wind speed, and ultraviolet (UV) radiation might have a reduction in transmission7,8,9,10,11,12,13,14,15. For example, in recent studies conducted worldwide, Jie et al. found that temperatures below 21 °C, relative humidity, and wind speed were negatively correlated with the number of daily cases for one year in 188 countries10. Simiao et al. investigated that 1° increase in absolute latitude is associated with a 4.3% increase in COVID-19 cases per million inhabitants which is consistent with the hypothesis that high temperature and UV radiation can contribute to the reduction in transmission11. Some of these investigated the possibility that the transmissibility is associated with temperature, where the transmissibility is often translated into the number of positive cases7,10,11,14; however, these studies did not fully account for the transmission dynamics influenced by PHSMs of various intensities. In this context, Yiqun et al. investigated the association of increased effective reproduction number and lower temperature (within the 20–40 °C range), lower humidity, and lower UV radiation15. Yet there is still divergence in the literature as another study indicated higher temperatures are not significantly associated with a reduction in total cases or effective reproduction number of COVID-19 in Canada16.A few of the earlier studies have explored the association between temperature and mortality7,17,18 as an indicator of the clinical severity. Previous studies showed a 1% increase in temperature was associated with a 1.19% decrease in daily new COVID-19 deaths in 166 countries17 and about 6% lower mortality in the subsequent 30 days from the first death in the OECD countries and US states19. Non-linear relationships of temperature and mortality have also been investigated in the time-series analysis as such the daily cumulative relative death risk decreased by 12.3% for every 1.0 °C increase in temperature20. However, day-to-day fluctuations in the number of deaths are also vulnerable to the epidemic dynamics. Transmission dynamics of infectious diseases should also be considered when performing the regression models because observation of each case with a contagious disease is not independent, which characteristics is referred to as dependent happening and explicitly distinguishable from other non-communicable diseases; otherwise, such inferences get largely biased21,22.The present study explored the association between temperature and both the transmissibility and the severity of COVID-19 from early 2020 to early 2021. We used the effective reproduction number ((R_{t} )), defined as the mean number of secondary cases generated by a single primary case, to quantify the transmissibility of the ongoing epidemic in Tokyo. To explore the association between temperature and severity, we used case fatality risk (CFR), an epidemiological measurement of severity. Crude CFR calculated from the ratio of the cumulative number of deceased cases to the cumulative number of confirmed cases can underestimate the actual CFR when cases are increasing and overestimate it when they are decreasing due to the time that passes from the onset illness to death. Such issues are also known as right censoring. We, therefore, estimated the time-delay adjusted CFR for every illness onset date, which accounted for the delay.The daily mean temperature from 15th February 2020 to 28th February 2021 in Tokyo is shown in Supplementary Fig. S1. Supplementary Fig. S2 (a) and (b) show the epidemic curves for confirmed cases by two age groups (under 70 s and over 70 s) and deaths, respectively. The epidemic curve and estimated median value of (R_{t}) with 90% credible intervals (CrI) from 15th February 2020 to 28th February 2021 are shown in Fig. 1. Analysing the impact of temperature on (R_{t}), the overall cumulative exposure–response relationship of temperature on (R_{t}) was non-linear, with lower temperature leading to higher RR (Fig. 2A). The RR corresponding to temperature at the first percentile (3.3 °C) was 1.3 (95% confidence interval (CI): 1.1–1.7). Figure 2B shows the three-dimensional plot of RR with temperature and lags up to 7 days. We found that the greatest risk of cold effects occurs in the day of exposure, increasing in 3–7 days of exposure.Figure 1Transmission dynamics from 15th February 2020 to 28th February 2021 in Tokyo, Japan. Blue line represents median, blue shading represents 95% credible intervals of the estimated effective reproduction number from 15th February 2020 to 28th February 2021. Green bars show the observed number of COVID-19 cases with confirmed dates in Tokyo.Figure 2Overall and three-dimensional plots of relative risks with the reference at 15.3 °C. (A) The three-dimensional plot of the association between daily mean temperature (°C) and the effective reproduction number over the lags of 7 days. The reference value of temperature was median temperature (15.3 °C). (B) The estimated overall effects of mean temperature (°C) over 7 days on (R_{t}). Blue line shows the mean relative risks, and 95% confidence intervals are shown in the gray shadings.Figure 3 shows the temporal variation of time-delay adjusted CFR and unbiased CFR from 25th May 2020 to 28th February 2021. As of 28th February 2021, the time-delay adjusted daily CFR and the unbiased CFR were 8.21% (95% CI: 4.50–12.9) and 2.42% (95% CrI: 2.41–2.43) (Supplementary Fig. 4), respectively. Figure 3 illustrates the temporal deviations from the baseline value of CFR, i.e., the unbiased CFR. To examine the potential for the temperature to contribute to changes in CFR, we estimated the overall effect of temperature with the reference of 18.6 °C (Fig. 4A). The harmful effect was seen to increase as temperature increased from the reference, and moderately cold temperatures were associated with high RRs of CFR. The three-dimensional plot of RR with temperature and lags for CFR is displayed in Fig. 4B, cold temperatures have an obvious impact on the day of exposure (lag day 0, the illness onset day) and we found a week delayed effect on both high and cold temperatures. The outcomes of the possible confounders are shown in Supplementary Table S4.Figure 3Temporal variation of time-delay adjusted case fatality risks (CFR) with unbiased CFR from 25th May 2020 to 28th February 2021 in Tokyo, Japan. The mean values of time-delay adjusted daily case fatality risks (CFR) from 25th May 2020 to 28th February 2021 are shown with a purple line. The shade region represents the 95% confidence intervals. The blue dot line shows the unbiased case fatality risk as 2.42% (95% credible interval: 2.41–2.43). If the time-delay adjusted daily CFR gets higher or lower, it is caused by random noises or other variables which have causal relationships. The unbiased case fatality risk plays a key role as a reference of the daily CFR.Figure 4Overall and three-dimensional plots of relative risks with the reference at 18.6 °C. (A) The three-dimensional plot of the association between daily mean temperature (°C) and time-delay adjusted case fatality risks (CFR) over the lags of 14 days. The reference value of temperature was median temperature (18.6 °C). (B) The estimated overall effects of mean temperature (°C) over 14 days on CFR. Blue line shows the mean relative risks, and 95% confidence intervals are shown in the gray shadings.Similar results were obtained in sensitivity analysis under different lags and adjustment of several meteorological variables (Supplementary Figs. S6–S11) for the transmissibility and severity analysis. We assessed the impact on the overall effects and delayed effect and successfully checked the robustness of the primary analysis.The present study was the first to comprehensively quantify the association between temperature and the epidemiological dynamics of COVID-19 in Tokyo using the effective reproduction number and time-delay adjusted daily CFR considering the lagged effect of temperature. Though the epidemiology of COVID-19 is differentiated by the substantial transmissibility and severity which are measured by reproduction number and CFR, there is no study to explore the contribution of temperature using both of the two rigorous epidemiological measurements appropriately, specifically the association between temperature and CFR, to our best knowledge.(R_{t}) rose explicitly at low temperatures; for example, RR of 3.3 °C (the 1st percentile of temperatures, defined as extremely cold temperature) was estimated as 1.3 (95% CI: 1.1–1.5) in the 0–1 days lag from an infected date (Supplementary Table S1), with median of all the temperatures (15.3 °C) as reference temperature. This indicates that the cold effects appear in short lags and the overall effect is more plausible in low temperature (Fig. 2A). Our results are consistent with most of the previous works in that COVID-19 incidence decreases as temperature increased and non-linear associations of temperature and COVID-19 transmissibility were observed15,23,24. In winter, human behaviors such as less ventilations in the rooms and close contact might contribute to high transmissibility25. In a recent study, relative impacts of meteorological factors compared to PHSMs were reported to be small in the early stage of the local epidemics as 2.4% and 2.0% of the variation in effective reproduction number are attributable to temperature and absolute humidity while 13.8% are explained by government response in 409 cities across 26 countries23. Another study in the USA investigated attributable fractions of temperature, specific humidity, and UV as 3.7%, 9.4%, and 4.4%, respectively and observed the differences of each factor depending on seasons15. Impacts of meteorological factors on both transmission and severity might depend on climate zones and seasons and further investigations in different climate conditions are helpful to understand the contributions of meteorological factors in accordance with varying phases of pandemic as an introduction of vaccination and distribution of variants.The exposure–response relationships of population mobilities and meteorological factors with (R_{t}) (Supplementary Table S2) are consistent with previous work12,13,26. For example, the residual and workplace mobility changes were not slightly related to the fluctuation of (R_{t}) while the recreation mobility change was significant. This relationship in Tokyo were reported in the previous study26. Analysis including the other possible meteorological factors, i.e., solar radiation and wind speed, have a slight difference compared to the main analysis (Fig. 2) as the shape of the exposure–response outcome shows (Supplementary Fig. S9).As for the severity, we found that low temperatures had a strong association with high CFR in the short lag periods. For example, RR of 2.3 °C (the 1st percentile of temperatures, defined as extremely cold temperature) and 5.8 °C (the 10th percentile of temperatures, defined as extremely cold temperature) were 2.0 (95% CI: 1.2–3.5) and 2.8 (95% CI: 1.7–4.7), respectively, in 0–2 days lag periods from illness onset dates (Supplementary Table S3), with a median of all the temperatures (18.6 °C) as reference temperature. While cold effects appeared in the short lag period and showed a slight gradual decline, extremely high temperatures were associated with higher CFR from few days after the illness onset, and those effects were stably maintained for two weeks (Supplementary Table S3).Plausible mechanisms explaining the association between temperature and high CFR of COVID-19 remain undetermined. Even though many studies have postulated seasonal variations and the impact of temperature in the transmissibility of infectious diseases, little is known about the association of temperature and severity of the contagious disease. Since the common infectious respiratory diseases such as the influenza virus, circulate in the cold season, the impact of high temperature on severity is yet to be explored. One study indicated that immune response against the common cold virus can be impaired under the environment with cold temperature27. As a previous study on the impact of heat effect showed, extreme high temperature dampens physiological responses when the body temperature exceeds its normal range28. These phenomena might have contributed to the result observed in the current study. For high CFR of moderate temperature, one of the possible explanations is the difference in human movement which can affect the exposure level with ambient temperature; however, further investigation is needed.There are several limitations to be noted. First, the effect of air particulates on increase in (R_{t}) and CFR were not considered in our study due to the data availability although some previous st
https://www.nature.com/articles/s41598-021-04242-3
The impact of temperature on the transmissibility potential and virulence of COVID-19 in Tokyo, Japan