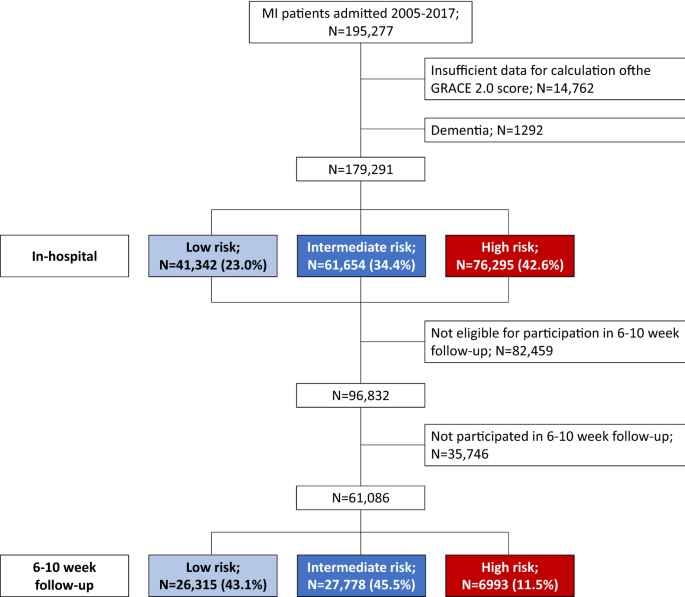
Risk-associated management disparities in acute myocardial infarction Despite improvements in the treatment of myocardial infarction (MI), risk-associated management disparities may exist. We investigated this issue including temporal trends in a large MI cohort (n = 179,291) registered 2005–2017 in SWEDEHEART. Multivariable models were used to study the associations between risk categories according to the GRACE 2.0 score and coronary procedures (timely reperfusion, invasive assessment ≤ 3 days, in-hospital coronary revascularization), pharmacological treatments (P2Y12-blockers, betablockers, renin–angiotensin–aldosterone-system [RAAS]-inhibitors, statins), structured follow-up and secondary prevention (smoking cessation, physical exercise training). High-risk patients (n = 76,295 [42.6%]) experienced less frequent medical interventions compared to low/intermediate-risk patients apart from betablocker treatment. Overall, intervention rates increased over time with more pronounced increases seen in high-risk patients compared to lower-risk patients for in-hospital coronary revascularization (+ 23.6% vs. + 12.5% in patients < 80 years) and medication with P2Y12-blockers (+ 22.2% vs. + 7.8%). However, less pronounced temporal increases were noted in high-risk patients for medication with RAAS-blockers (+ 8.5% vs. + 13.0%) and structured follow-up (+ 31.6% vs. + 36.3%); pinteraction < 0.001 for all. In conclusion, management of high-risk patients with MI is improving. However, the lower rates of follow-up and of RAAS-inhibitor prescription are a concern. Our data emphasize the need of continuous quality improvement initiatives. The past decades have seen considerable improvements in the management of patients with myocardial infarction (MI). This applies to the more frequent use of invasive treatments but also of medications with proven prognostic benefit1,2,3. Guidelines stress the importance of formal risk assessment to identify MI patients at highest risk for poor outcome in order to customize management. However, several studies demonstrate an underutilization of beneficial interventions in high-risk patients1,4,5,6, a phenomenon labelled treatment-paradox. The clinical dimension of this problem is amplified by the fact that high-risk patients often derive greater treatment benefit compared to lower-risk patients. While efforts have been made to reduce these disparities1, they still appear to exist. Several studies investigating this important issue however, only focused on invasive treatments6,7, and there is a paucity of data on temporal changes in management patterns in contemporary real-world cohorts1.The GRACE 2.0 score is a well-validated tool for the prediction of all-cause mortality in acute coronary syndrome7. The score employs non-linear functions to model risk based on age, heart rate, systolic blood pressure, creatinine as continuous variables, and Killip class, cardiac arrest at admission, ST-segment deviation and elevation of circulating biomarkers of myocardial necrosis as categorical variables. The GRACE 2.0 score has recently been given a class IIa recommendation in European guidelines8.Using the GRACE 2.0 score, the aims of the present study were (1) to investigate risk-associated management disparities in a large cohort of MI patients during the course of disease, from early invasive assessment to secondary prevention, and (2) to assess whether the magnitude of potentially existing treatment disparities might have changed over time. We hypothesized that management of MI patients still differs among patient categories at different levels of risk whilst the broad uptake of guideline-based management recommendations1,2,3 has reduced the dimension of this issue.This study is part of the TOTAL-AMI (Tailoring of Treatment in All comers with Acute Myocardial Infarction) project. The primary aim of TOTAL-AMI is to study the mechanisms and implications of different MI subtypes9 and of comorbidities (e.g. chronic obstructive pulmonary disease, atrial fibrillation, renal dysfunction) in MI. TOTAL-AMI uses data from SWEDEHEART (Swedish Web-system for Enhancement and Development of Evidence-based care in Heart disease Evaluated According to Recommended Therapies) which is a registry collecting data from patients admitted to Swedish coronary care units or other specialized facilities because of suspected acute coronary syndrome. In subregistries, data on in-hospital management (Register for Information and Knowledge about Swedish Heart Intensive Care Admissions [RIKS-HIA]), invasive procedures (Swedish Coronary Angiography and Angioplasty Registry [SCAAR]) and follow-up 6–10 weeks after hospital discharge (Secondary Prevention after Heart Intensive care Admission Registry [SEPHIA]) is aggregated. SWEDEHEART provides almost nationwide coverage and lifelong follow-up. Upon hospital admission, patients receive information about SWEDEHEART, have the right to deny participation and to get their data erased upon request. Written informed consent is not required according to Swedish law.The population for the present study included all MI patients admitted between January 2005 and May 2017 with complete data necessary for the calculation of the GRACE 2.0 score 7. Only the first registered MI during the study period was considered. The follow-up cohort consisted of MI patients aged < 75 years, managed at hospitals participating in SEPHIA. Patients at higher ages had no scheduled follow-up within the SEPHIA framework during the study period. For surviving patients not participating in the 6–10 week follow-up, a fictive follow-up date at 60 days from hospital admission was created in the dataset. This corresponds to the mean timepoint from admission at which follow-up took place in those who participated (60 ± 14 days). Non-participants who had died before this date were censored.All data had been made pseudonymized before the statistical analyses. The study was conducted according to the principles of the 1975 Declaration of Helsinki and had been approved by the Regional Ethical Review Board in Stockholm (2012/60-31/2).Investigated medical interventionsWe studied the rates of the following medical interventions that are partly incorporated as quality/performance measures in the SWEDEHEART quality index10: Coronary procedures: early reperfusion (thrombolysis ≤ 30 min or percutaneous coronary intervention [PCI] ≤ 90 min from first ECG) in ST-elevation MI (STEMI), coronary angiography ≤ 3 calendar days from admission in non-ST-elevation MI (NSTEMI), in-hospital PCI or coronary artery bypass grafting (CABG); Pharmacological treatments: discharge medication with P2Y12-blockers, betablockers, renin–angiotensin–aldosterone-system (RAAS)-inhibitors or statins; Follow-up and secondary preventive measures: Participation in the 6–10 week follow-up, self-reported smoking cessation, participation in exercise training within a cardiac rehabilitation programme. Since some treatment decisions might have been affected by the presence or absence of specific comorbidities or contraindications, we applied the following intervention-specific exclusion criteria: Total cohort: dementia; Coronary angiography ≤ 3 days (NSTEMI): hemoglobin < 80 g/L, estimated glomerular filtration rate (eGFR; CKD-EPI equation) < 20 mL/min/1.73 m2; In-hospital PCI/CABG: hemoglobin < 80 g/L, eGFR < 20 mL/min/1.73 m2; Discharge medication with P2Y12-blockers: hemoglobin < 80 g/L; Discharge medication with betablockers: heart rate < 50/min; Discharge medication with RAAS-inhibitors: eGFR 0.50 in patients without concomitant diabetes, hypertension or known heart failure. Statistical analysisAll continuous variables were skewed and are reported as medians with 25th and 75th percentiles. Categorical variables are expressed as frequencies and percentages. The prognostic accuracy of the GRACE 2.0 score was estimated by the calculation of the c-statistics. Kaplan–Meier curves were plotted to illustrate the occurrence of death across risk cohorts defined by estimated probabilities of 1-year all-cause mortality of 8% (high risk) according to the GRACE 2.0 score.Multivariable logistic regressions were used to investigate the associations between risk categories and the use of medical interventions. Adjustment was made for admission year, hospital, sex, current smoking, diabetes, previous MI, previous coronary revascularization, previous heart failure, previous stroke, atrial fibrillation upon admission, chronic obstructive pulmonary disease, previous or present cancer, and peripheral artery disease. Since the decision to perform PCI/CABG depends on the extent of coronary stenoses, information on coronary findings (categorized as normal or non-occlusive disease, 1–2 vessel obstructive disease, 3-vessel obstructive disease/left main stem and inconclusive findings) was included in models investigating in-hospital PCI/CABG. Similarly, models investigating discharge medication with P2Y12-blockers were additionally adjusted for in-hospital PCI/CABG. Clinical data employed as GRACE 2.0 score components were not considered in the models. Results are presented as odds ratios (OR) with 95% confidence intervals (CI). Since OR may overestimate true effect sizes in case of high intervention rates, we pragmatically focused on those with rates below benchmarks adopted from the SWEDEHEART quality index: ≥ 75% for coronary interventions, ≥ 85% for pharmacological treatments, ≥ 75% for participation in the 6–10 week follow-up, ≥ 60% for smoking cessation and ≥ 50% for participation in exercise training10.Temporal changes in the use of medical interventions were assessed (1) by inclusion of an interaction term between calendar year and risk group in the fully adjusted logistic regression, and (2) by additional adjustment for the two first vs. the two last years of the observation period as explanatory covariates.In explorative analyses, we repeated all calculations in patients aged < 80 years since treatment decisions tend to be highly individualized in patients at higher age, an entity that also contributes to higher GRACE 2.0 score.No imputation was performed in case of missing data. In all tests, a two-sided p value < 0.05 was considered significant. The software package SPSS 27.0 (SPSS Inc., Chicago, IL) was used for the analyses.The study cohort consisted of 195,277 unique patients with MI. Following exclusions, 41,342 (23.1%), 61.654 (34.4%) and 76,295 (42.6%) patients had low, intermediate and high estimated probabilities of 1-year mortality, respectively. The proportions of low-risk patients and intermediate-risk patients increased by + 2.3% and + 4.0% during the observation period, respectively, whereas the proportion of high-risk patients decreased by -6.1%. Totally 61,086 patients had a follow-up visit at 6–10 weeks. Of these, 26,315 (43.1%), 27,778 (45.5%) and 6993 (11.5%) patients had low, intermediate and high estimated probabilities of 1-year mortality, respectively. An overview of excluded patients and the numbers of patients per GRACE 2.0 score risk category overall and among those who participated in the 6–10 week follow-up is presented in Fig. 1. Further information on clinical characteristics, medical interventions and eligible patients for the respective analyses is presented in Table 1 and Supplementary Table S1. Data on the timing of reperfusion was missing in 15,107 (23.3%) STEMI patients and data on the timing of invasive assessment was missing in 28,531 (28.8%) NSTEMI patients. Excluding patients who did not receive any of these interventions left 8168 (12.6%) STEMI patients with missing data on early reperfusion and 704 (0.7%) NSTEMI patients with missing data on coronary angiography ≤ 3 days. Patients with missing data were older, more likely to be female, had higher prevalence of cardiovascular comorbidities and considerably worse outcome compared to those being included in the main analyses (Supplementary Table S2A and B).Figure 1Table 1 Clinical characteristics and medical interventions in relation to GRACE 2.0 score categories.During 1 year of follow-up, 25,837 (14.4%) patients died (low risk: 585 [1.4%] patients, intermediate risk: 3394 [5.5%] patients, high risk: 21,858 [28.6%] patients). Figure 2 illustrates the cumulative probability of 1-year all-cause mortality across risk cohorts. The overall prognostic accuracy of the GRACE score was high with a c-statistics of 0.829 (95% CI 0.826–0.831).Figure 2Cumulative incidence of 1-year all-cause mortality across patient cohorts with low, intermediate and high risk.High risk according to the GRACE 2.0 score was associated with less use of early reperfusion in STEMI, coronary angiography ≤ 3 days in NSTEMI and in-hospital PCI/CABG (Table 2). High-risk patients were less likely to be discharged with P2Y12-blockers and RAAS-inhibitors. Prescription rates of betablockers and statins exceeded 85% in the total population (Table 1) and were thus, not considered in the multivariable models. High-risk patients moreover, less often participated in the 6–10 week follow-up. Among those who attended follow-up, high risk patients less often participated in exercise training and were less likely to have stopped smoking.Table 2 Utilization of medical interventions in high-risk patients.The temporal trends for medical interventions are depicted in Figs. 3, 4 and 5. Overall intervention rates increased when comparing the two first with the two last years of the observation period. The only exception was smoking cessation with an overall low rate of 36.5%. A trend towards a more pronounced temporal increase of P2Y12-medication was noted in high-risk patients compared to lower-risk patients (+ 22.2% vs. + 7.8%), as demonstrated by the interaction analysis (pinteraction < 0.001) and non-overlapping 95% CI of the OR comparing the two first with the two last years of the observation period. In contrast, temporal increases were less pronounced in high-risk patients for RAAS-inhibitor medication (+ 8.5% vs. + 13.0%) and participation in the 6–10 week follow-up (+ 31.6% vs. + 36.3%); pinteraction < 0.001 for both. The temporal changes in the other investigated interventions did not differ among risk cohorts.Figure 3Temporal changes in coronary interventions. (A) Early reperfusion in STEMI; (B) coronary angiography ≤ 3 days in NSTEMI; (C) in-hospital PCI/CABG. Percentages refer to changes in the rates of coronary interventions from 2005/2006 to 2016/2017. p int. refers to the interaction between year of admission and risk group on the utilization of coronary interventions. Odds ratios (OR; with 95% confidence intervals) describe the adjusted associations of the year of admission (2005/2006 vs. 2016/2017) with coronary interventions. STEMI ST-elevation myocardial infarction, NSTEMI non-ST-elevation myocardial infarction, PCI percutaneous coronary intervention, CABG coronary artery bypass grafting.Figure 4Temporal changes in pharmacological treatments at discharge. (A) P2Y12-blockers; (B) RAAS-inhibitors. Percentages refer to changes in the rates of pharmacological treatments from 2005/2006 to 2016/2017. p int. refers to the interaction between year of admission and risk group on the utilization of pharmacological treatments. Odds ratios (OR; with 95% confidence intervals) describe the adjusted associations of the year of admission (2005/2006 vs. 2016/201
https://www.nature.com/articles/s41598-021-03742-6
Risk-associated management disparities in acute myocardial infarction