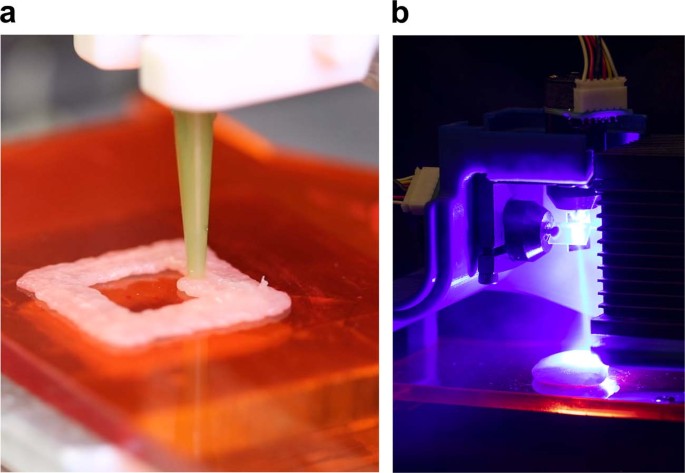
Precision cooking for printed foods via multiwavelength lasers npj Science of Food 5, Article number: 24 (2021) Cite this article 5393 Accesses 346 Altmetric Metrics Design, synthesis and processingEngineering Additive manufacturing of food is a method of creating three-dimensional edible products layer-by-layer. While food printers have been in use since 2007, commercial cooking appliances to simultaneously cook and print food layers do not yet exist. A key challenge has been the spatially controlled delivery of cooking energy. Here, we explore precision laser cooking which offers precise temporal and spatial control over heat delivery and the ability to cook, broil, cut and otherwise transform food products via customized software-driven patterns, including through packaging. Using chicken as a model food, we combine the cooking capabilities of a blue laser (λ = 445 nm), a near-infrared (NIR) laser (λ = 980 nm), and a mid-infrared (MIR) laser (λ = 10.6 μm) to broil printed chicken and find that IR light browns more efficiently than blue light, NIR light can brown and cook foods through packaging, laser-cooked foods experience about 50% less cooking loss than foods broiled in an oven, and calculate the cooking resolution of a laser to be ~1 mm. Infusing software into the cooking process will enable more creative food design, allow individuals to more precisely customize their meals, disintermediate food supply chains, streamline at-home food production, and generate horizontal markets for this burgeoning industry. Digitizing the cooking process using additive manufacturing (AM) techniques and software-controlled lasers enables temporal and spatial control of the arrangement of ingredients and the delivery of heat to raw food with millimeter precision1,2,3,4. Experimental food printing was introduced in 20075, and while food printers have the ability to deposit materials to mm-scale resolution, they don’t yet have the ability to cook foods to this same degree of resolution. Integration of a multiwavelength laser cooker onboard a food printer can provide both penetrative heating and surface browning6,7,8,9,10, which would generate more creative food combinations and taste profiles.Studies on the printing of various food products11,12,13,14,15,16,17,18,19 and the laser cooking of select foods4,20,21,22,23 exist, but none have investigated the use of lasers in the cooking of printed meats, tandem printing and cooking on a singular machine or organoleptic evaluation of laser-cooked meat. Current food printers do not allow us to print a layer of chicken, for example, and simultaneously reach both the required browning as well as adequate inside cooking temperatures amidst layers of printed carrot purée (Supplementary Fig. S1). Integration of a multiwavelength laser cooker onboard a food printer can skirt this obstacle by providing penetrative cooking and surface browning3,6,7,8,9,10 (Supplementary Video 1).Here, we investigate the feasibility of printing (Fig. 1a) and cooking (Fig. 1b) food in tandem, using puréed chicken as a model food system. A 5–10 W blue diode laser (445 nm) was used as the primary heating source, but comparative tests were also done with an NIR laser (980 nm), MIR laser (10.6 μm), and a conventional toaster oven. We deduce energy required to achieve food safe temperatures in chicken; calculate cooling rates of lased chicken; investigate associated weight and volume losses with laser-broiled and oven-cooked chicken; assess color change in lased chicken; demonstrate the penetrative heating of blue and infrared light with chicken; brown chicken through plastic packaging via NIR laser (~90% transmission through plastic)24; and sample laser-cooked meat. Cooking trials with printed chicken samples were performed on two separate machines initially, and were then executed on the same machine. When printing and cooking were executed on the same machine, laser exposure took place after a complete layer was printed.Fig. 1: Printing and cooking apparatus.a Close-up of raw chicken being deposited in a square pattern from our food printer. b A blue laser beam being directed by a set of mirror galvanometers to a raw sample of chicken.We performed a series of trials varying laser cooking pattern (increasing density, radius, path length, Δ density and randomness) (Fig. 2a) to characterize energy requirements for laser cooking, ambient cooling effects, cooking pattern efficiency, cooking loss in heated samples (Fig. 2b), color change, and browning capabilities through packaging. Unless otherwise noted, all tests were performed on a single layer of printed chicken (~1.5 mm) (Fig. 2c).Fig. 2: Laser cooking pattern and temperature sensing.a Foundational laser cooking pattern used during testing showing variations that were made to alter cooking results. Illustration is in the form of a triangle, but the perimeter can take the shape of any closed contour. b Shrinkage (%) of two-layer printed chicken sample documented after each repetition of the cooking pattern with the blue laser. c Unfiltered and filtered images of chicken being laser-cooked. d Eight thermocouples were placed for square prints (top) and four thermocouples were used for triangular prints (bottom).Energy required for food safe temperaturesAchieving food safe temperatures25,26 is vital for qualifying lasers as a processing technique. To assess thermal energy required for cooking, we traced a spiraling trochoidal path (Fig. 2a) with the blue light over the sample. More passes of the cooking pattern at higher laser speed resulted in much quicker initial temperature increases followed by much slower successive heat increases until food safe temperatures were achieved (Fig. 3a, b). Conversely, exposing the sample to a single pass of the laser at a much slower cycle speed decreased the rate at which the maximum temperature in the sample increased.Fig. 3: Temperature progression during cooking (each line represents a single test).a Maximum internal temperature achieved for triangular printed samples at various repetitions (shaded region for each line shows standard error from four thermocouples of a single sample). b Maximum internal temperature achieved for square printed samples at various repetitions (shaded region for each line shows standard error from four thermocouples of a single sample). c Surface temperature of four different voxels of chicken on the same heat-affected sample for a single rep cooking cycle. The curves range in color from green (voxel along the edge of sample) to red (voxel in the center), as does the graphic of the cooking pattern used which starts along the edge (green) and spirals in toward the center (red) of the sample.Triangular prints required 8 min while square prints required 9–10 min of consistent exposure from the blue laser to achieve an acceptable final cook temperature of 74 °C. Total laser energy required to cook a printed triangle was ~2.4 kJ and 2.7–3 kJ for a printed square (blue laser operates at 5 W). Energy requirements to reach a temperature of 70 °C26 and fully eradicate Salmonella—one of the more common food borne illnesses—are ~0.3 kJ less than what is required to reach a food safe temperature. Based on these energy requirements and the relative size of the two printed shapes, an energy per area of 5–7 MJ/m2 of printed chicken is required to achieve food safe cooking temperatures. A more powerful laser at similar energy flux would accelerate the cook time per unit area of food.Rate of coolingThe ‘pulsed heating’ effect from laser scanning4 is captured in Fig. 3c and Fig. 4 where each spike occurs when the optical center of the laser passes over a volumetric pixel—or ‘voxel’—of the printed sample. Because the laser scan gradually spirals toward the center of the sample, voxels along the edge of the sample have higher initial peaks and gradually lose amplitude, while voxels closer to the center of the sample have higher amplitudes at the end of the cooking cycle.Fig. 4: Surface temperature during laser cooking at different time stamps, t(see Supplementary Video 2 for animations of these surface plots).a Visual rendering of chicken sample with superimposed spiral cooking pattern showing six shells of a repeated trochoidal pattern. Pattern transitions from green (starting position) to red (ending position) throughout the duration of the time stamp to the left of each tile. b Infrared camera readings from surface of chicken sample at a particular snapshot in time. c Aggregated maximum temperature recorded on the surface of the chicken sample up until the particular snapshot in time. The 2D gray transparent plane in (b and c) shows the minimum food safe temperature needed to eradicate Salmonella and E. coli (70 °C). An IR camera was used to capture surface temperature data for the laser-heated poultry samples.In between each pulse of laser heat, Newton’s law of cooling27 can be visualized (visible in Fig. 3c). The rate of cooling is dictated by the inverse response time k (in units of s−1), which determines the exponential rate by which a material cools over time. The average k for a voxel of chicken was ~0.0229 s−1 with a standard error of 0.0006. This value was computed by taking the average cooling rate across a 30 s span just after a laser pulse for nine different trials. Therefore, under normal ambient conditions, we can approximate the cooling rate as$$Tleft( {{{mathrm{t}}}} right) = T_{{{mathrm{a}}}} + left( {T_0-T_{{{mathrm{a}}}}} right)e^{ – .0229,t}$$where T(t) is the temperature at time t, Ta is the ambient temperature, and T0 is the temperature at time t = 0 s. Based on the thermal properties of chicken28 and the length scale of the heated sample we are assuming a Biot number that is <0.1. The rate at which food cools plays an important role in determining the population of microbial pathogens in food29. Therefore, by calculating the cooling rate we can more accurately predict the fluctuations in chicken temperature over time and fine tune laser parameters to ensure the food stays above a certain threshold for food safety and consumption.Cooking efficiencyLarger discrepancies between real-time and maximum recorded temperature at various time steps (Fig. 5) correspond to less efficient heating patterns since the printed sample experiences greater heat loss to the ambient. Keeping total cook time constant, more ambient cooling is observed with multiple shorter passes (Fig. 5a) versus a single pass of the laser (Fig. 5b–f). With the blue laser pumping continuous energy into the system, maximum temperature continues to increase while real-time temperature follows an increasing oscillatory trajectory where the number of local maximum (peaks) corresponds to the number of cycles (for Fig. 5a) or shells of the trochoidal pattern (for Fig. 5b–f).Fig. 5: Comparing fluctuations in realtime internal temperature readings to maximum recorded internal temperature readings in laser-cooked printed chicken samples.Since the laser provides pulsed heating, regions of the food will cool unless they have direct beam exposure, which is why we are comparing realtime with maximum recorded temperature as a way of visualizing the ambient cooling taking place during the cook cycle. For the following test cases, a single printed layer of chicken was used (2.5 mm × 24 mm × 24 mm), a trochoidal pattern with six shells was used with a consistent circle radius (1.5 mm). The shape of the cooking pattern used for (c–f) was the same with the only variation being the speed of the moving laser. The density of the circles for each successive ring decreased by 0.5 rev/mm for (c) while remaining constant at 12 rev/mm for (b). Shaded region for each line shows standard error from eight thermocouples in a single sample. a Cycle time of 149 s (2:29) with four repetitions (9:56). b Cycle time of 630 s (10:30). c Cycle time of 630 s (10:30). d Cycle time of 550 s (9:10). e Cycle time of 511 s (8:31). f Cycle time of 471 s (7:51). Shaded region for each line shows standard error from eight thermocouples.Contrary to conventional cooking on a range or in a microwave, which provides more uniform heating30,31,32,33, samples that are laser-cooked experience bursts of energy from the moving beam of light. As the laser propagates along the surface of the printed chicken (Fig. 4), a thermal peak follows the path of the beam as it makes contact with the food surface—also evident from Fig. 3c. Factors such as circle density, circle diameter, and speed of the laser all affect the shape and amplitude of the thermal peak.Cooking loss and colorWeight loss and shrinkage of heated poultry samples are both directly correlated to thermal exposure time (Fig. 6). Dry air heating in an oven at 300 °F (149 °C) and 400 °F34,35 (204 °C) was used as a comparative study. Oven-broiled samples lost nearly twice as much weight and volume as compared to laser-heated samples for comparable exposure times (Fig. 6a). Shrinkage for laser-broiled samples plateaued around 24% (Fig. 6b) while oven-broiled samples were higher around 40%. Chicken cooked via blue laser showed an increase in L from 70.9 to 89.6, a decrease in a from 7.8 to −0.5, and a decrease in b from 16.3 to 11.2. L increased in ov
https://www.nature.com/articles/s41538-021-00107-1
Precision cooking for printed foods via multiwavelength lasers