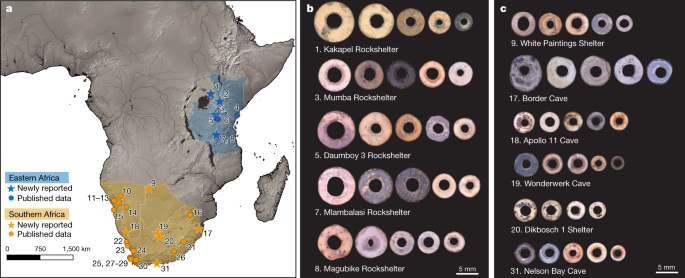
Ostrich eggshell beads reveal 50,000-year-old social network in Africa Humans evolved in a patchwork of semi-connected populations across Africa1,2; understanding when and how these groups connected is critical to interpreting our present-day biological and cultural diversity. Genetic analyses reveal that eastern and southern African lineages diverged sometime in the Pleistocene epoch, approximately 350–70 thousand years ago (ka)3,4; however, little is known about the exact timing of these interactions, the cultural context of these exchanges or the mechanisms that drove their separation. Here we compare ostrich eggshell bead variations between eastern and southern Africa to explore population dynamics over the past 50,000 years. We found that ostrich eggshell bead technology probably originated in eastern Africa and spread southward approximately 50–33 ka via a regional network. This connection breaks down approximately 33 ka, with populations remaining isolated until herders entered southern Africa after 2 ka. The timing of this disconnection broadly corresponds with the southward shift of the Intertropical Convergence Zone, which caused periodic flooding of the Zambezi River catchment (an area that connects eastern and southern Africa). This suggests that climate exerted some influence in shaping human social contact. Our study implies a later regional divergence than predicted by genetic analyses, identifies an approximately 3,000-kilometre stylistic connection and offers important new insights into the social dimension of ancient interactions. Unresolved questions in human evolution concern the ancient distribution and diversification of our species (Homo sapiens) across Africa2,5. The metapopulation model suggests that anatomical modernity and behavioural complexity arose within a pan-African patchwork of populations who experienced pulses of connection and isolation6, possibly in response to environmental circumstances1,7. Research into these shifting connections is increasingly derived from DNA and ancient DNA analyses, which reveal that present-day African hunter–gatherer populations diverged into regional lineages sometime in the Pleistocene, including a deep division between southern and eastern groups approximately 350–70 ka3,4,8. Although ancient DNA is a powerful tool for acquiring information about biological exchange, it is unable to address the cultural context of ancient interactions. Many questions about these ancient interactions remain, such as where and when did ancient populations connect, what social exchanges took place and what mechanisms provoked their eventual isolation.Beginning in Marine Isotope Stage 3 (approximately 57 ka), African populations underwent substantial social reorganization9,10,11. Numerous advancements appear around this time, but an important new feature is the manufacture of beads12 (Supplementary Discussion 1). The systematic production of beads is a considerable labour investment, and signals the increasing scale and importance of social interactions in Marine Isotope Stage 3 (ref. 13), perhaps relating to the growing population size and social systems evident around this time11. These societal reforms signal that the African Late Pleistocene is a crucial period for understanding the development of complex social networks.Ostrich eggshell (OES) beads are the oldest fully manufactured beads and could be key to revealing Late Pleistocene social dynamics in Africa. They emerged in eastern Africa by 52 ka12, in southern Africa by 42 ka14 and are still produced in some areas today. Modern ethnographic research in Africa indicates that a finished piece of OES beadwork (for example, a beaded skirt) carries symbolic meaning15. However, individual beads can also preserve social information, as every step in their production is a deliberate choice that intensifies morphological differences16 (Supplementary Discussion 2). These manufacturing decisions are cultural norms that are commonly shared between neighbouring groups, while long distances reduce transmission opportunities leading to cultural variation or drift17,18,19,20. Therefore, the characteristics of OES beads can be used as a means to reconstruct population interaction. Previous studies linked the introduction of herding into southern Africa (approximately 2 ka) with the appearance of larger-diameter OES beads21,22, indicating possible connections with eastern African populations, as supported by archaeological and genetic evidence4,21,23. Some recent studies have reported stylistic variation within Late Pleistocene sites24,25,26,27; however, to our knowledge, there has been no attempt to use similar variation to explore population contact in the Pleistocene.Episodes of population connection and isolation have been linked with environmental shifts1,2, and over the past 50,000 years (kyr), climatic events have triggered temperature fluctuations and hydroclimatic reorganization in Africa28,29,30. These shifts could have fragmented habitable areas, in turn affecting where and when regional populations could interact. Therefore, it is critical to explore how intergroup connectivity may correspond with climatic and environmental changes in the Late Pleistocene.In this study, we analysed OES bead characteristics from the past 50 kyr in search of patterns that reveal population connections, and their association with hydroclimate shifts in Africa. We compiled data from 31 sites in eastern (22.5–40° E, 9° N to 9° S) and southern Africa (8–35° E, 20–35° S), totalling 1,516 individual beads (Fig. 1, Supplementary Table 1), with 1,238 of these being fully reported for the first time. We recorded three metric variables wherever possible (bead diameter, aperture diameter and shell thickness). Our database comprises securely dated Pleistocene sites with available data, and well-dated sequences in each region, with age estimates drawn from direct radiocarbon dates, dated archaeological layers or bracketing layers. To understand the potential effects of climate on these patterns, we divided the past 50–2 kyr into four periods based on major glacial and interglacial shifts (Supplementary Discussion 3): phase I: 50–33 ka (Marine Isotope Stage 3 to the reinvigoration of ice-sheet growth); phase II: 33–19 ka (ice-sheet growth to the end of Last Glacial Maximum); phase III: 19–11.6 ka (last deglaciation); and phase IV: 11.6–2 ka (Early Holocene epoch to before the spread of herding into southern Africa). Phase V (2 ka to present) marks the previously identified shift in bead sizes that emerges as herding spreads into southern Africa. We expect to see population connections indicated by similar bead characteristics, and that periods of isolation may parallel climatic shifts.Fig. 1: Locations of sites included in this study and palaeoclimate records.Base map modified from Natural Earth. a, Kakapel Rockshelter (1); Enkapune ya Muto (2); Mumba Rockshelter (3); Panga ya Saidi (4); Daumboy 3 Rockshelter (5); Kisese II Rockshelter (6); Mlambalasi Rockshelter (7); Magubike Rockshelter (8); White Paintings Shelter (9); Geduld (10); Lower Numas Cave (11); Lower Orabes Shelter (12); Leopard Cave (13); Eros (14); Wortel (15); Bushman Rockshelter (16); Border Cave (17); Apollo 11 Cave (18); Wonderwerk Cave (19); Dikbosch 1 Shelter (20); Sehonghong (21); SK2001.026 (22); Rooiwal Hollow/Midden (23); Varsche Rivier 003 (24); Paternoster (25); Grassridge Shelter (26); Witklip (27); Kasteelberg A + B (28); Geelbek Dunes (29); Voelvlei (30); Nelson Bay Cave (31). b, Representative OES beads from sites in eastern Africa. c, Representative OES beads from sites in southern Africa.Our results reveal that eastern and southern African OES beads take unique stylistic trajectories through time (Fig. 2a). Phases and regions are both important factors driving the variation in OES bead characteristics (Pillai’s trace = 0.60, F3,1319 = 664.8, P < 0.001 for region and Pillai's trace = 0. 18, F12,3963 = 21.34, P < 0.001 for phase), although interaction between phases and regions do not appear to significantly influence OES bead characteristics (Pillai's trace = 0.02, F9,3963 = 2.22, P = 0.02; Supplementary Table 2).Fig. 2: OES bead diameter, thickness and aperture diameter distribution through the past 50 kyr in eastern and southern Africa.a, Generalized additive model plots to show bead characteristic evolutionary trajectories. The mean (curved lines) and 95% confidence interval are shown for each parameter. b, Split violin plots of bead parameters. The violins represent the kernel density of the frequency distribution, and the points are presented as mean values ± one standard error. Statistical results are shown in Supplementary Tables 5–7, 11. The asterisks denote the significance of region differences (*P < 0.01 and ***P < 0.001). When no significance between two regions was found, P values are presented.In eastern Africa, the range of bead and aperture diameters remain consistent over 50 kyr, with only minor fluctuations. Eastern beads average 6.9 ± 1.2 mm in diameter and 2.6 ± 0.6 mm in aperture diameter (Fig. 2a), with a wide range of variation. By contrast, southern bead characteristics have changed through time, with larger bead and aperture diameters in phase I (50–33 ka) and significantly smaller characteristics in the younger phases (Pillai's trace = 0.113, F9,3147 = 13.4, P < 0.001; Fig. 2a, Supplementary Table 3). While southern beads virtually disappear from the archaeological record in phase II (33–19 ka), they re-emerged around the onset of deglaciation (approximately 19 ka) with consistently smaller sizes. From phases III–V (19 ka to present), southern bead diameters and aperture diameters are smaller with narrower ranges (4.5 ± 0.9 mm and 1.8 ± 0.4 mm, respectively) than their eastern counterparts. They remained in this consistently smaller style until after 2 ka when larger bead characteristics, associated with the movement of pastoral communities, appeared in southern Africa (multivariate analysis of variance (MANOVA) Pillai's trace = 0.004, F3,700 = 1.05, P = 0.371; Supplementary Table 4) (Figs. 2b, 3).Fig. 3: Comparison of bead characteristics between eastern and southern Africa during the past 50 kyr.a, Principal component analyses (PCA) of OES bead metric parameters for phases III–V. Diameter, aperture diameter and thickness account for more than 89% of the variation, separating eastern and southern Africa into distinct groups. PCA clustering for two regions for phase II and phase I is not possible due to insufficient data. b, Paired diameter and aperture diameter for each phase. Newly reported data: collected by authors, reported as individual beads; published data: drawn from published metrics, reported as individual beads; average data: drawn from published metrics, reported as averaged values.We found distinct regional clusters with varying degrees of overlap throughout phases III–V (19 ka to present) using principal component analysis for specimens with all three metric parameters (n = 1,333) (Fig. 3a). PC1 and PC2 explain 92%, 91% and 93% of variations between southern Africa and eastern Africa for phase III (19–11.6 ka), phase IV (11.6–2 ka) and phase V (2 ka to present), respectively (Fig. 3a). The univariate analysis of variance (ANOVA) performed on the MANOVA outputs showed that all three parameters have a role in driving the regional differences in phases III–V (ANOVA P < 0.001 for all tests; Supplementary Tables 5–7). We further explored these regional differences using the two most commonly reported variables (bead diameter and aperture diameter), which slightly increased sample size to 1,445 beads (Fig. 3b). Our MANOVA results using only these two variables confirmed that bead characteristics are significantly different between the two regions during phases III–V (19 ka to present) (Fig. 3b, Supplementary Tables 8–10). Compared with the more distinct regional bead clusters in phase III (19–11.6 ka) and phase IV (11.6–2 ka), the beads in phase V (2 ka to present) show increased overlap between eastern and southern Africa. Despite this overlap, most southern beads in phase V (2 ka to present) remain smaller, consistent with phase III (19–11.6 ka) and phase IV (11.6–2 ka) (Figs. 2b, 3b).Bead characteristics in phase I are nearly identical for eastern and southern Africa (Pillai's trace = 0.15, F2,36 = 3.2, P = 0.052; Figs. 2b, 3b, Supplementary Table 11), with similarities driven by bead diameter and aperture diameter (ANOVA P = 0.08 and 0.02, respectively; Supplementary Table 11). The average OES bead diameters in southern Africa are larger in phase I (6.7 mm) than those in other time periods by more than 2 mm, making them more similar to sizes in eastern Africa (average diameters of more than 6.9 mm) (Fig. 3b). The majority of southern beads (12 out of 14) derive from a single site—Border Cave—which has a wide range of diameters (4.3–8.1 mm). The remaining beads are one each from VR003 and White Paintings Shelter. Both sites are located significantly further west, but each bead is 5.7 mm in diameter, which falls within the range of diameters from Border Cave.Shell thickness is not a stylistic trait, but instead may reflect a complex relationship between environment and ostrich. Both regions maintain consistent shell thickness over the entire 50 kyr period, with eastern African shells averaging 1.7 ± 0.2 mm, and southern shells averaging 1.5 ± 0.2 mm (Fig. 2b). This appears to contradict previous suggestions that shell thickness varies in response to temperature and aridity31. While thickness does not vary within each region through time, it is significantly different between the two regions (P < 0.0
https://www.nature.com/articles/s41586-021-04227-2
Ostrich eggshell beads reveal 50,000-year-old social network in Africa