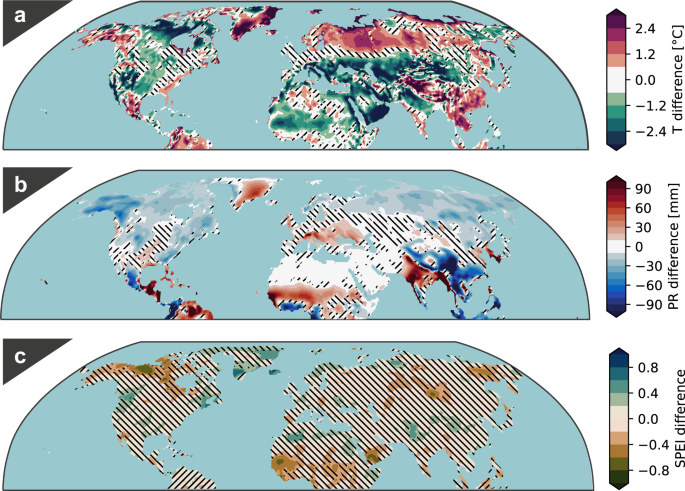
Northern Hemisphere drought risk in a warming climate Drought frequency and severity are projected to increase in the future, but the changes are expected to be unevenly distributed across the globe. Based on multi-model simulations under three different future emissions and shared socioeconomic pathways, we show that a significant drought intensification is expected in dry regions, whereby the severity depends on greenhouse gas emissions and development pathways. The drought hotspots are located in the sub-tropical regions where a moderate to extreme summer drought in today’s climate is expected to become a new normal by the end of the 21st century under the warmest scenario. On average, under the warmest future scenario, the drought occurrence rate is projected to be 100% higher than that of the low emission scenario. Further, for the regions which are currently less affected by long-lasting droughts, such as the European continent, climate models indicate a significant increase in drought occurrence probability under the warmest future scenario. In recent decades, historical climate observations have shown that many parts of the world are experiencing longer and more intense droughts as a consequence of observed atmospheric warming1. As a result, hydrological conditions are changing with potential regional climate change impacts on the society and ecosystems2,3,4. Changing drought characteristics can lead not only to increased crop failures5, but also shifts in the entire ecosystem and vegetation zones6. Knowledge about the future drought occurrences, intensification and spatial distribution is therefore essential for developing adaptation policies and strategies.In general, future drought projection is challenging since several relevant variables and complex processes contribute to the occurrence and severity of droughts. However, all drought-relevant variables are not necessary represented well in the general circulation models (GCMs). In particular, future changes in potential evapotranspiration (E0) and precipitation, which are integral parts of the hydrological cycle, are of major interest7,8. Different multimodel efforts have explored climate change impacts on regional drought variability, e.g. the studies based on Fifth Phase of the Coupled Model Intercomparison Project (CMIP5)9. Based on the CMIP5 simulations, hotspots of increased drought risk and severity have been identified10, and the mechanisms behind the changes of the key drought related variables, e.g., precipitation, E0 and large-scale atmospheric circulation, have been investigated11,12,13,14,15. Nevertheless, it is important to revise the previous assessment based on the recently released state-of-the-art model simulations participating in Phase Six of the Coupled Model Intercomparison Project (CMIP6)16. The main motivation is that the physical descriptions of the climate system in CMIP6 simulations, spatial resolution, and the climate forcings have improved substantially16. To investigate droughts several indices are available in the literature17. In this study, the Standardized Precipitation Evapotranspiration Index (SPEI)18,19, which represents a significant part of the atmospheric water balance, is used20. The advantage of the index is that it can be used for comparison across locations with different climatology because it is a standardized index for a given location relative to its long-term climatology21.Using a multi-model ensemble mean drawn from CMIP6 database, we evaluate and investigate changes in the key driving factors of droughts, namely precipitation and E0 in the historical runs and the radiative forcing scenarios developed for ScenarioMIP22. In this study, the conditions of low (Shared Socioeconomic Pathways 1–2.6; SSP1–2.6), medium (SSP2-4.5) and high (SSP5-8.5) emission scenario are investigated. Furthermore, we compute the occurrence rate of dry periods for the updated regions of Sixth Assessment report (AR6) of the Intergovernmental Panel on Climate Change (IPCC)23. The presented study focuses on the Northern Hemisphere during summer (June, July and August (JJA)), the season with the highest E0 and the highest spatial distribution of droughts3. The overarching goal is to investigate the evolution of summer temperature and precipitation across different CMIP6 forcing scenarios, tendencies towards a wetter or drier climate and the occurrence of moderate to extreme droughts in three scenarios.In order to understand how drought is expected to change in the future using climate models, the quality of the simulations should be evaluated first. For this purpose, we perform a comparison between observed averages of summer temperature, precipitation and drought with modeled climate simulations for the period 1971 to 2000 (Fig. 1). Positive (negative) valuates indicate that the ensemble mean of the models has a greater (lower) value than that of the observations.Fig. 1: Comparison of the modeled and observed climate for the period 1971–2000 (JJA only).a–c The climate simulations are averaged over the entire period and then subtracted from observations. a surface air temperature, b precipitation and c SPEI. The hatched areas indicate areas with insignificant changes according to the two-sided Student’s t test (p < 0.05).In Fig. 1a, Greenland and western Russia, parts of the Himalayas and Southeast Asia are significantly colder in the multi-model ensemble than in reality. In contrast, northern Canada, parts of central North America, northern India, the Arabian Peninsula and a band from the Mediterranean to central Asia are significantly warmer in the modelled climate state than in reality. Another pattern is shown in the precipitation difference (Fig. 1b) where large parts of North America, northern Central America, Southeast Asia and North Asia are characterized by significantly larger precipitation in the model ensemble mean. On the other hand, substantial underestimation of precipitation in the multi-model ensemble is observed in the northern Mediterranean region, southern Sahara and northern part of India compared to the observations. Nonetheless, the difference map of SPEI shows no significant overall difference between the model simulations and observations except in some small regions (Fig. 1c). Only small parts of northern North America, West Africa and the southern Arabian Peninsula and Greenland show a significant difference.To investigate the consistency of the observed and climate model ensemble trends, we compare the differences of the temporal evolution of observed and modelled climate conditions for the periods 1975 to 1989 and 2000 to 2014 (Fig. 2). More specifically, we compare the relative change based on observations and historical model simulations during two historical periods (2000–2014 vs. 1975–1989). For all three variables, a negative value indicates a stronger trend between the two time periods in the observations than the climate model ensemble (a positive value represents the opposite). Comparison of temperature trends indicates that large parts of North America, Central Asia and Northwest Africa experience a higher temperature increase in observations than represented by the ensemble mean (Fig. 2a). In contrast, the ensemble mean shows a more pronounced warming trend in the eastern and northern Mediterranean region, northern Russia and northern Canada compared to observations. Considering precipitation (Fig. 2b), the trend in the Indian monsoon region is it is noticeably stronger than that of the ensemble mean of simulations. In addition, the difference in simulated and observed SPEI between these two periods shows that Central Europe, Central Africa and North Greenland experience a much stronger trend in observations relative to the ensemble mean (Fig. 2c). On the other hand, Central North America and Northern Canada are characterized by a stronger trend in the ensemble mean compared to the observations (Fig. 2c).Fig. 2: Differences in trends in climate model simulations and observations.a–c The differences are shown for the periods 1975–1989 and 2000 to 2014 (JJA only) in CMIP6 historical simulations relative to observations. A value of 0 represents that the trend in observations is the same as that of the model ensemble. Negative values indicate that trend in observations is stronger than in the model ensemble, whereas positive values show the opposite case. a Surface air temperature, b precipitation and c SPEI.Projected summer temperature changesFuture drought conditions, among others processes, depend on the temperature variability. Rising air temperature nonlinearly increases the saturated water vapor pressure at a rate of approximately 7%/K according to the Clausius-Clapeyron relationship24. The increasing water holding capacity of air can lead to a higher amount of water that can theoretically evaporate (increase of E0). Changes in the greenhouse gas concentration combined with other local geographical and biophysical features can change the spatial and temporal variability of the temperature heterogeneously. The heterogeneity of the temperature pattern is shown in Fig. 3 for the Northern Hemisphere, where the temperature conditions for three different emissions are represented in terms of anomaly plots, i.e., the difference between the projected climate condition (2071–2100) and the historical (1971–2000) baseline.Fig. 3: Projected changes to the Northern Hemisphere summer temperature.a–c Spatial distribution of the summer temperature anomalies in the Northern Hemisphere based on the multi-model projected changes (2071–2100) based on SSP1-2.6 (a), SSP2-4.5 (b) and SSP5-8.5 (c) scenarios relative to the historical summer temperature during the 1971–2000 baseline period. All changes are significant according to the two-sided Student's t test (p < 0.05).An overall significant increase of the average summer temperature is shown in the Northern Hemisphere under all three future scenarios (Fig. 3), but with substantial variability in the magnitude and spatial variability among them (compare Fig. 3a, b and c). Under SSP1–2.6 (which represents a total anthropogenic forcing of 2.6 W m−2)22 the temperature increase is relatively homogenous over the whole Northern Hemisphere, with the magnitudes varying between 1 and 3 °C. A stronger warming is observed under SSP2–4.5 (which represents a total anthropogenic forcing of 4.5 W m−2)22 with summer temperature increases between 3° to 5 °C across the midlatitudes and the subtropics. The most affected areas, in terms of warming levels, are the Mediterranean region, Central North America, parts of Greenland and Siberia and Central Asia (Fig. 3b) located in the subtropics, midlatitudes and the high latitudes.Similar warming hotspots are also observed under SSP5–8.5 scenario (Fig. 3c), which represents an anthropogenic forcing of 8.5 W m−2. The spatial variability of the temperature anomalies under SSP5–8.5 is higher compared to the other two scenarios (SSP-2.6 and SSP-4.5). In the Northern Hemisphere, the average summer temperature increases between 3° to 8 °C, with the hotspots (the Mediterranean region, Central North America, parts of Greenland and Siberia and Central Asia) expected to experience between 7° and 8 °C of increase in temperature by the end of the century. Furthermore, it is noticeable that the tropics experience a weaker warming rate relative to the subtropics or mid-latitudes in all three scenarios. This is in agreement with the future warming distribution projections from other studies based on CMIP525 and CMIP626 (to evaluate consistency across CMIP6 simulations see Supplementary Fig. 1).In addition to the average summer temperature, the same results are also presented for the maximum temperature (Tmax) and minimum temperature (Tmin) in Supplementary Figs. 2–5. The anomaly plots of both quantities share spatial characteristics similar to average temperature shown in Fig. 3. Nevertheless, the magnitudes of Tmax increases are more pronounced in the aforementioned hot spots relative to the Tmin.Projected precipitation and potential evapotranspirationThe hydrological cycle is strongly dominated by the variability and amount of precipitation as the key driver of other variables such as runoff and soil moisture. Change in precipitation variability in the multi-model simulations and observations under the three scenario runs are shown in Fig. 4. The smallest absolute changes are found under SSP1–2.6 (Fig. 4a). Results show significantly more precipitation (20–40 mm) over a central band from East to West Africa and Southeast Asia. A smaller rate of precipitation increase is found in North Asia, Alaska and eastern coasts of North America. However, a significant precipitation deficit is shown in Central America and parts of the Mediterranean region. This is in agreement with previous studies based on CMIP527 and CMIP628 that indicate strengthening of the future Asian–northern African monsoon leading to wetter conditions, and weakening of the North American monsoon causing a drying pattern. According to recent findings28, the greenhouse gas forcing induces a stronger ‘land-warmer-than-ocean' pattern, which enhances the Asian and West African monsoon low pressure system leading to increases in monsoon rainfall in these regions, and an El Niño–like warming, which reduces the North American monsoon rainfall.Fig. 4: Changes to summer precipitation under SSP1-2.6, SSP2-4.5 and SSP5-8.5.a–c Averaged anomalies of summer precipitation under SSP1-2.6 (a), SSP2-4.5 (b) and SSP5-8.5 (c) in the Northern Hemisphere. A reference period of 1971–2000 relative to the period 2071–2100 is used for deriving anomalies. The hatched areas indicate areas with insignificant changes according to the two-sided Student's t test (p < 0.05).The precipitation changes for the other two scenarios (Fig. 4b and Fig. 4c) look very similar to SSP1–2.6 from a spatial point of view. However, the precipitation anomalies are larger and more spread out spatially relative to the presented hotspots in Fig. 4a. See for example the positive precipitation anomalies on the east and north coasts of Asia, North America and Europe in Fig. 4c relative to 4a. The precipitation increase on the east shores of Asia and North America is likely because of higher water holding capacity of the atmosphere and warm water transport from ocean circulation. Fig. 4c indicates that Central America, Europe (except Northern Europe), North Africa, Central Asia will likely experience a significant negative precipitation anomaly compared to the historical observations. To evaluate consistency of the multi-model CMIP6 ensemble members the interested reader is referred to Supplementar
https://www.nature.com/articles/s41612-021-00218-2
Northern Hemisphere drought risk in a warming climate