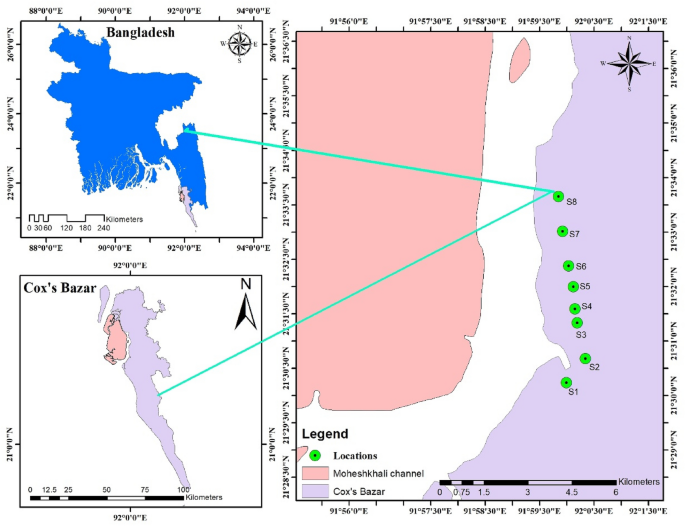
Microplastics pollution in salt pans from the Maheshkhali Channel, Bangladesh Md. Refat Jahan Rakib1, Sultan Al Nahian2, María B. Alfonso3, Mayeen Uddin Khandaker4, Christian Ebere Enyoh5, Fauziah Shahul Hamid6,7, Abdullah Alsubaie8, Abdulraheem S. A. Almalki9, D. A. Bradley4,10, Hamidreza Mohafez11 & Mohammad Aminul Islam12 Scientific Reports 11, Article number: 23187 (2021) Cite this article Microplastics (MP) were recognized as an emergent pollution problem due to their ubiquitous nature and bioaccumulative potential. Those present in salt for consumption could represent a human exposure route through dietary uptake. The current study, conducted in Bangladesh, reports microplastics contamination in coarse salt prepared for human consumption. Sea salt samples were collected from eight representative salt pans located in the country’s largest salt farming area, in the Maheshkhali Channel, along the Bay of Bengal. Microplastics were detected in all samples, with mean concentrations ranging from 78 ± 9.33 to 137 ± 21.70 particles kg−1, mostly white and ranging in size from 500–1000 µm. The prevalent types were: fragments (48%) > films (22%) > fibers (15%) > granules and lines (both 9%). Fourier transform mid-IR and near-IR spectra (FT-MIR-NIR) analysis registered terephthalate (48%), polypropylene (20%), polyethylene (17%), and polystyrene (15%) in all samples. These results contribute to the MP’s pollution knowledge in sea salts to understand and reduce this significant human exposure route and environmental pollution source in the future. Plastic pollution in the marine environment has become a major global problem1. The degradation of the plastic waste in the seawater is not the end of the problem as the microplastics (MP) generated have a destructive potential for the environment. Added to this is the release of chemical compounds, further worsening the damage to the environment2. Furthermore, most plastics in the environment endure for a very long time3. According to the G20 Implementation Framework for Actions on Marine Plastic Litter, 20 countries are responsible for 80% of the plastic debris found in the sea, from which 90% originate from land-based sources. According to a study by Jambeck et al.4, the significant percentage of the world’s ocean plastics pollution is from Asia, with China contributing 28% of the mismanaged plastic waste, followed by Indonesia (10%), the Philippines and Vietnam (both 6%), Thailand 3.2%, Egypt 3%, Nigeria 2.7%, and South Africa 2%.MPs become more threatening than large plastic materials because they could be swallowed and concentrated by aquatic organisms, including plankton5, 6. A lower limit to MP size study has not yet been defined, although most investigations have focused on the 0.3–5 mm size range7. MP can be classified into two basic groups, namely primary and secondary, depending on their origin. Primary MP are industry-made particles, mainly used in commercial formulations, from cosmetics and toothpaste to micro-additives in synthetic paints and coatings8. Secondary MP results from the fragmentation of larger plastics8.When it comes to MP pollution, salts for consumption are not exempt from the problem. Table salts are obtained from mining mineral rock or the evaporation of water sources at sea1. During the production process, saltwater undergoes different physical processes. It is first pumped into evaporation ponds, subsequently concentrated and crystallized by the action of the sun and wind, then being cut and packed for sale9. Accordingly, the final product may contain concentrates of the anthropogenic contaminants already present in the saltwater10.Sea salt is highly commercialized, being consumed worldwide, with the number of studies focusing on MP pollution in table salts increasing11, 12. Around 60 salt processing mills exist in the Cox’s Bazar district in Bangladesh9, wherein washing, crushing, iodine mixing, drying, and packing are carried out. About 25% of the raw salt is transformed as waste during processing, while the remaining 75% is crushed and packed as iodide salt and distributed throughout the country, predominantly for human consumption. Despite the high consumption rates, there has been a lack of data on the presence of MP in table salt from Bangladesh. Therefore the present study seeks to analyze for the first time the abundance, characteristics, and polymer composition of MP pollution in commercial salts obtained from salt pans along the Bangladesh coast. It is expected that this study will form a baseline for MP salt pollution for the country, also enhancing knowledge about this emergent pollutant issue.Located at the head of the Bay of Bengal, the coastline of Bangladesh represents a diversified hydro-geo-morphological environment, with several interruptions by estuarine inlets13. The present study was performed in the Maheshkhali Channel (MC), located on the southeast coast of the Bay of Bengal (Fig. 1). The channel includes the Bakkhali River to the south, discharging domestic, agricultural, and industrial waste before falling into the Bay14, 15. This area has a semidiurnal tidal regime, with sea currents increasing from south to north, mainly near the coastal area16. Its hydrology is also heavily influenced by the monsoon season (June–September)9. The surrounding area to MC is highly urbanized, including Chittagong in the north, forming the second-largest city in Bangladesh (approaching 8,440,000 inhabitants) and Cox’s Bazar beach at the east (with 85,000 daily visitors) (Fig. 1), the longest natural beach in the world with many hotels, a fishing industry, tourism and unplanned urbanization (e.g., a camp for displaced Rohingya refugees)9.Figure 1The geographic location of the sampling points along the Maheshkhali Channel coast. This map was constructed using ArcGIS 10.7.The MC is one of the most popular places in Bangladesh for salt production9. Extended mud flat shores are present along its coast, where most salt pans have been established9. The post-monsoon season (November to April) gives rise to favorable meteorological conditions for salt production, farmers selling the raw salt directly to traders9. Besides salt pans and processing industries, other productive activities developed in this area are traditional fisheries, commercial shrimp farms, a fishing port, fish processing industries, ship and boat making factories, and paint industries. Therefore, MC is seriously impacted by chemical effluents and waste effluents from many unplanned industries14.Samples collectionA total of eight representative salt pans (large in terms of relative size or hosting the greatest numbers of salt pans in a particular location) were selected to collect the samples for this study. Unrefined sea salt for consumption samples were collected from the selected natural salt pans along the southeast coast of MC (S1-S8) (Fig. 1). Sampling was performed between August (2020) and September (2021) (the post-monsoon period). Approximately 500 g of salts were collected using a metal spoon at each site, placed in a clean labeled 1 L glass bottle, and transported to the laboratory.Samples digestion and treatmentEach sample was divided into three (n = 3) subsamples for further analyses. Then 100 mL of 30% H2O2 were added to each sample in cleaned glass flasks and heated in a bath held at 65 °C for 24 h to digest any organic matter (Fig. 2). Approximately 1000 mL of filtered water was added to each bottle, and a glass rod was used to stir the salts until fully dissolved. The obtained salt solution was immediately filtered with cellulose nitrate filter paper (47 mm diameter, 0.45 μm pore size) using a vacuum system. The filter was then placed into a clean glass Petri dish and dried at room temperature.Figure 2Procedural steps for microplastics analysis in sea salts samples. This diagram was constructed using PowerPoint 2016.Quality controlAll liquids were filtered using 0.45 μm pore size filter paper before use to avoid MP contamination. Also, all the glass material was rinsed three times with purified water. The samples were kept covered when they were not under analysis. Lab staff used cotton lab coats and nitrile gloves to avoid any source of extraneous plastic contamination. Three blank samples without salt were analyzed simultaneously to correct for any possible MP contamination from sample processing. No MP were found in blank samples.Visual observation and polymer FT-MIR-NIR analysisThe filters were visually inspected using an Olympus SZX16 stereomicroscope, and images were taken. Visual assessment was performed in order to identify the shape and color of MP. Then, particles were randomly selected from each site (approximately 30%) for Fourier Transform Mid- and Near-Infra Red (FT-MIR-NIR) polymer analysis using a Perkin Elmer FT-MIR-NIR system. MP abundance was calculated based on visual observation and FT-MIR-NIR plastic polymer confirmation. For FT-MIR-NIR analysis, the spectrum range was set to 4000–675 cm−1 with a 3 s and 8 cm−1 resolution collection for all samples. All the spectra were then compared with the spectra library to identify the polymer type.Data analysis and risks assessmentStatistical analysis was performed using SPSS Version 20 (IBM®). Results were reported as mean values and standard deviation from replicates. Due to the non-normal distribution of data, the Kruskal–Wallis test followed by pairwise Dunn’s tests were performed to determine any differences in MP concentrations among sampling sites17. Results were presented as boxplot and p-values. Statistical significance was set at p < 0.05.MP risks assessmentBesides the residual monomers, additional polymerization pollutants may be present in a plastic object. These include oligomers, low-atomic-weight polymer segments, catalyst residues, and polymerization solvents, as well as a broad range of plastic additives, such as handling aids and final product additives18. Because the majority of these non-polymeric segments have a low atomic weight, they could migrate from the MP item into the salt and then into humans, where they may cause damage. Therefore, it is crucial to estimate the risks of these polymers. The risks assessment of MP in the salt were estimated using the polymer risk indices (pRi) following the procedure detailed in previous work18, presented in Eqs. (1) and (2) as follows:$${pR}_{i}=sum left(frac{{p}_{i}}{{p}_{T}} times {S}_{j}right)$$$${pR}_{overall}=({pR}_{1}times {pR}_{2}times {pR}_{3}times dots {pR}_{n}{)}^{1/n}$$where pi is the number of each MP polymer observed in salt sample i and pT is the total number of different MP polymers identified in salt sample i. Sj is the chemical toxicity coefficient or risk score, given as Polyethylene (PE), 11; Polyethylene terephthalate (PET), 4; Polypropylene (PP), 1, and Polystyrene (PS), 3018. The polymeric risk indices (pRi) classification is as follows: low when 120018. Due to the simplicity of the index, it could be applied to different types of environments, but at the same time, the conclusions from it are limited and should be considered with caution.In Table 1 MP abundance (mean value ± standard deviation) values are presented by shape, size range, color and polymer type categories for each sampling site. MP were found in all analyzed salt samples including pellets, fibers, fragments, films and lines (Fig. 3). MP total abundance values per site ranged from 74.7 to 136.7 particles kg−1 in the following order of increasing abundance: S3 < S1 < S2 < S4 < S5 < S6 < S8 < S7 (Fig. 4, Table 1). The measured values show significant difference among sites (Kruskal Wallis, p = 0.013). The Dunn's test results reveal significant differences, with S1, S2 and S3 differing from S7 (p = 0.006; p = 0.007 and p = 0.005, respectively) and S8 (p = 0.023; p = 0.028 and p = 0.019, respectively), S3 also being significantly different from S6 (p = 0.05).Table 1 Microplastic abundance (Particles kg−1) (Mean value ± SD) by shape, color, size range and, polymer categories in unpacked coarse salt samples from stations S1 to S8 (n = 3).Figure 3Photographs of different MP shapes found in salt samples: (a) red fragment; (b) blue fragment; (c) pellet; (d) line.Figure 4Box plot of MP abundance (particles kg−1) for the sampling sites S1 to S8.It is expected that MP in seawater was the primary source of contamination of the sea salts19,20,21,22. According to these results, MP contamination in the salt pans from the Maheshkhali Channel coast can be classified into three zones of increasing pollution: a lower zone (S1 to S3), an intermediate zone (S4 and S5), and a higher zone (S6 to S8). A possible explanation for these values could be the different disposition of the study sites in the channel and the hydrology and current (rate of water movement) differences. According to Misra et al.16, seawater current flows with higher intensity from the south of the Bay of Bengal to the north. Therefore, any MP in seawater flowing from the Bay of Bengal inside MC (S1 to S8 direction) will probably accumulate in the inner part of the channel. However, the higher MP concentration in S7 with respect to S8 suggests that other environmental variables or anthropogenic sources could affect MP presence in MC, and more variables should be assessed in future studies to arrive at better conclusions. It should also be mentioned that the plastic film used in salt pans for desiccation is of high potential as a source of MP. Other possible MP sources could be plastic pollution from fishing, urbanization, and tourism activities in the surrounding area. Furthermore, runoff from the land and atmospheric fallout could also be potential contributory pathways23, not least given that Bangladesh is subject to the influence of the monsoon, with high rain values and salt production developing after the monsoon season9. Future research, including seawater and atmospheric MP samples, should be considered to confirm these assumptions.Although there are no previous studies of MP abundance in salt samples, other studies have been conducted in the coastal zone of the Bay of Bengal adjacent to Bangladesh. A study conducted by Rahman et al.24 in beach sediments from Cox's Bazar beach registered relatively low MP values of 8.1 ± 2.9 particles kg−1 while, in a study of intertidal sediments from the same area by Hossain et al.25, higher MP values of 368.68 ± 10.65 particles kg−1 were reported. Both studies attributed their spatial MP variation to be due to the tidal current, wave energy, beach orientation, river discharges, and human activity. Finally, another study in beach sediments found MP concentrations up to 1100 particles kg−1, attributing these high values to increasing urbanization and tourism26.The results obtained in this study have been compared with other salt studies worldwide (Table 2). However, it should be mentioned that most studies were developed with refined commercial sea salt samples and not from field salt pans as in this case. In addition, the different analytical methods used for MP determination difficult results comparison. The MP concentrations found in the salts from MC are similar to those reported by studies in Brazil, Mexico, South Korea, and Indonesia12, 27 (Table 2). On the other hand, studies of salt samples from the Atlantic and Indian Oceans12, the Pacific Ocean (China and Thailand)19, and the Mediterranean Sea (Croatia, Italy)27, 28 presented higher MP concentrations (Table 2). These studies detected the presence of MP of smaller size than those registered here, supporting the observation of the higher values. It could be expected that the fragmentation of MP particles during salt processing for commercial salts could also be contributing to the increasing number of particles found in salt samples.Table 2 Compariso
https://www.nature.com/articles/s41598-021-02457-y
Microplastics pollution in salt pans from the Maheshkhali Channel, Bangladesh