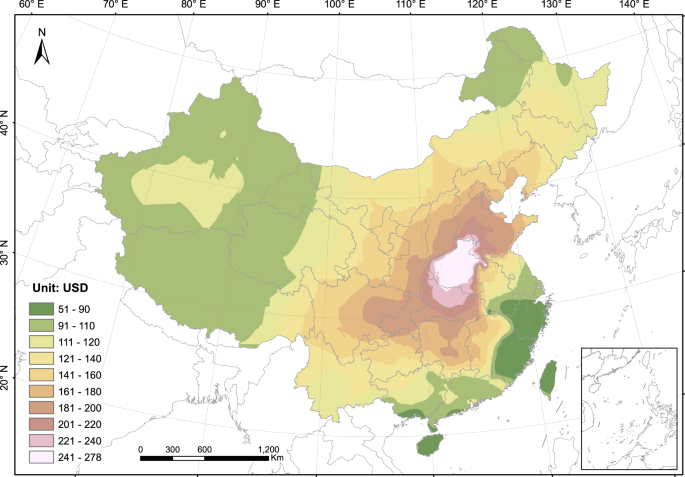
Location-specific co-benefits of carbon emissions reduction from coal-fired power plants in China Climate policies that achieve air quality co-benefits can better align developing countries’ national interests with global climate mitigation. Since the effects of air pollutants are highly dependent on source locations, spatially nuanced policies are crucial to maximizing the achievement of co-benefits. Using the coal power industry as a case study, this study presents an interdisciplinary approach to assessing facility level co-benefits at every specific source location in China. We find that co-benefits range from US$51-$278 per ton CO2 reduction nationwide and are highly heterogeneous spatially, with ‘hotspot’ regions that should be the priority of emissions reduction policies, and that provinces should use different techno-economic strategies to reduce emissions. The location-specific co-benefit value plus a carbon price serves as a unified environmental indicator that enables policy makers to more accurately understand the social costs of electricity generation from coal burning and provides a scientific framework for geographically nuanced policymaking. Developing countries, such as China and India, face the dual challenge of climate change and air pollution, with the latter usually more urgent and directly associated with domestic welfare1,2. Therefore, integrating air pollution control into climate governance can be a highly effective means to motivate developing countries to accelerate climate change mitigation3. Reducing CO2 emissions from electric power generation will simultaneously reduce the emissions of sulfur dioxide (SO2), nitrogen oxides (NOx), and primary PM2.5. While the effects of carbon emissions are independent of source locations, the effects of air pollutant emissions are highly dependent on source locations, population distribution, climate, and other factors4,5. Thus, spatially nuanced policies are key to maximizing the co-benefit of climate policy in air-quality improvement and the related health gains.The electric power sector is the largest source of carbon emissions in China, accounting for roughly half of the country’s total carbon emissions6,7. There were over 2000 coal-fired power plants in Mainland China’s 31 provinces in 2017, with generation capacity of 980 GW and electricity generation of 4.1 trillion kWh, accounting for 55% of total capacity and 65% of total generation, respectively8. Meanwhile, coal-fired plants have been a major cause of the country’s serious air pollution in recent years9,10, contributing to 17%, 19%, and 8% of China’s total SO2, NOx, and primary PM2.5 emissions, respectively, in 201711. In response, China has adopted three major strategies to reduce the environmental impacts of power plants: eliminating plants with outdated technologies, ultralow emissions retrofitting, and optimizing the siting of plants, and substantial financial and administrative resources have been invested by plant owners and the government12,13,14. When these resources are constrained, all three strategies need to prioritize certain regions, and this prioritization requires location-specific social and economic justifications.In the past several years researchers have made significant progress in estimating the social costs of air pollution, particularly in terms of the impacts on human health. Most of these studies used atmospheric chemical transport models and exposure–response functions with different assumptions. For example, Anenberg et al.15 and Lelieveld et al.2 estimated the global burden of mortality due to air pollution, and found anthropogenic O3 and PM2.5 were associated with more than four million premature deaths annually. Other researchers combined the above methodologies with climate mitigation scenarios, and then assessed the co-benefits of climate policies in air pollution reduction and other environmental issues16,17,18,19,20,21. For instance, Shindell et al.19 investigated methane reduction measures that can reduce global mean warming by 0.5 °C, and estimated that the co-benefit in avoiding premature death was between US$700 to 5000 per ton of methane emissions. West et al.20 calculated the co-benefits of climate policies under the Representative Concentration Pathway 4.5 (RCP4.5) scenario, and estimated the value to be US$50–380 per ton of CO2 reduction. For China-focused studies, Li et al.17 applied global models to the latest Chinese data and estimated that a 4% annual reduction in energy intensity would lead to a 24% reduction in CO2 emissions in 2030 relative to the no policy case; such a reduction would require a carbon price of $72 per ton and lead to $340 billion in avoided health costs in 2030; Cai et al.16 estimated that in 2050 the overall health co-benefits would be 3–9 times of the implementation costs if China fulfills its Paris commitments. One common feature of the existing studies is that they present only aggregated global or national effects of air pollution and the corresponding co-benefit valuations, and lack facility level, location-specific information22. Although informative at a macro-level, aggregated results are difficult to translate into implementable policies, which often requires differentiated treatments based on locations and technology types.To address this gap, we establish an interdisciplinary approach to assess facility-level co-benefits at specific locations. Our model takes advantage of a complete coal plants dataset, the latest fine-scale demographic and health data, and air pollution exposure estimations calibrated specifically for coal plants in China. Our analyses capture technological features, fuel quality, and the specific location of each individual power plant, as well as the relevant demographic, economic, weather, and epidemiological information of affected regions. We find that co-benefits in ‘hotspot’ locations can be up to five times higher than those in more distant locations, and that provinces should use different techno-economic strategies to reduce pollutant emissions. The co-benefit value of per ton CO2 reduction plus a carbon price can serve as a unified indicator that integrates the environmental costs of CO2 and air pollutants, which has straight-forward policy interpretations, and can significantly improve the design of China’s emissions trading system, environmental pollution taxes, and other policies aimed at changing the country’s fossil-fuel-dominant energy structure.We obtained the locational health co-benefits of per ton carbon emissions reduction in four major steps (see details in ‘Methods’ and Supplementary Fig. 1): (1) using an intake fractions (IFs) model to estimate population exposure to air pollutants from power plants; an IF is defined as the fraction of material or its precursor released from a source that is eventually inhaled by a population; (2) estimating mortality due to increase in exposure to air pollution; (3) economic valuation of air pollution-related mortality based on value of statistical life (VSL) method; (4) calculating co-benefits based on emitting ratios of CO2 and air pollutants. Figure 1 presents the health co-benefits of reducing one ton CO2 emissions from a power plant at each specific location in China. Higher values indicate that phasing out or retrofitting existing plants, or prohibiting the construction of new plants in these areas, will achieve greater co-benefits.Fig. 1: Health co-benefits of per ton CO2 emission reduction from coal-fired power plants in different locations.The unit is in U.S. dollar (USD). Higher values indicate that phasing out or retrofitting existing plants, or prohibiting the construction of new plants in these areas, will achieve greater co-benefits.There are four major factors that influence the location-specific health co-benefits: (1) the technological specifications of a power plant, including coal use per unit electricity generation, whether or not it has SO2−, NOx−, and PM-removal facilities, coal quality, etc.; (2) population density and GDP per capita within different ranges from a plant, which affects the value of economic loss caused by air pollutants; (3) baseline mortality rates of diseases related to air pollution, including ischaemic heart disease (IHD), chronic obstructive pulmonary disease (COPD), and lung cancer, which have different relative risk factors corresponding to PM2.5 concentration levels; and (4) local climatic conditions, most importantly precipitation levels. For each specific plant, the relative importance of the four factors can vary significantly. We conduct multiple simulations to assess the relative importance of each factor on average (Supplementary Note 1). Overall, population density has the dominant impact on co-benefit values, and precipitation and technology specifications (represented by emission factors) have modest impacts, while baseline mortality rate change has a relatively small impact.With regional-grid average technology specifications, the building of a power plant at different locations will yield vastly different co-benefit values, ranging from US $51 to 278 per ton CO2 nationwide (Fig. 1). The most prominent ‘hotspot’ region with the highest co-benefit values is around Henan province in central China. The primary reason for this is that air pollutants can be transported across vast distances, affecting populations more than 1000 km away—and Henan is the geographic centre of China’s population distribution. Therefore, plants in Henan have maximal influence on air quality of the entire country. Besides Henan and adjacent regions, the Beijing–Tianjin–Hebei and Chengdu–Chongqing metropolitan areas also have high co-benefits values, mostly due to their highest population densities in the country. The Shanghai and Hong Kong–Guangzhou–Shenzhen metropolitan areas have the highest population density and GDP per capita in the country, but their values are relatively low, due to a combination of four factors: advanced electricity generators, high quality coal with lower sulfur and ash content, low baseline mortality rates of diseases related to air pollution, and a higher level of precipitation. China’s western and northeastern provinces have relatively low values, primarily because of their much lower population densities. The southeastern provinces, such as Zhejiang and Fujian, while populous and economically advanced, have the lowest values, for the same reasons as Shanghai. Overall, Fig. 1 provides a basis for China to set the order of priority for regional energy planning and transitioning away from coal.We analyse how the pattern in Fig. 1 changes under different assumptions in Supplementary Notes 2 and 3. First, we re-estimate co-benefits using VSLs based on GDP per capita at each city, in contrast to a universal national VSL used in Fig. 1. Second, a power plant can have many detrimental effects on adjacent areas other than PM2.5 (e.g., coal ash and heavy metal deposition). We multiply the economic loss within 100 km by three to take into account the other negative local impacts (see ‘Methods’). Third, we re-estimate co-benefits using different national VSLs and elasticities based on literature review. The corresponding results are presented in Supplementary Figs. 2–6.Co-benefits at provincial levelWhile results in Fig. 1 enable precise policy making for each specific location, in practice, many policies are implemented at municipal or provincial scales. For instance, China’s carbon emissions trading pilot programmes are operated at the provincial level, and the national emissions trading programme needs to decide allowance allocations across provinces23. Thus, we use capacity-weighted mean of co-benefit values for all individual plants in a province to represent the co-benefit value in that province (Fig. 2), and use the same method to calculate the national co-benefit. The national capacity-weighted average co-benefit value is $147. Provincially, again, Henan has the highest co-benefit value at $257, followed by Hubei at $207 and Shandong at $192. Values in Beijing ($180), Tianjin ($183), and Hebei ($183) are not among the highest, even though these provinces had the strictest policies for coal plants phasing-out or retrofitting: using VSLs based on local GDP per capita and higher weights for local effects will yield relatively higher values for these provinces (Supplementary Fig. 4c, d). In general, co-benefits values in the ‘hotspot’ provinces can be 2–4 times higher than those in other provinces, indicating the importance of prioritizing coal use reduction in ‘hotspot’ provinces and using differentiated carbon pricing and environmental taxes at the provincial level.Fig. 2: Capacity-weighted average health co-benefits of per ton CO2 emission reduction in different provinces.The unit is in U.S. dollar (USD). Darker colour indicates that a province has a higher capacity-weighted average health co-benefit value.While Figs. 1 and 2 present the damage caused by power plants located in different regions, Supplementary Fig. 7 presents the economic losses suffered at different locations due to air pollution from all power plants. The annual national loss added up to 460.1 billion USD in 2017 or around 3.7% of the country’s total GDP in the same year. Figure 3 illustrates the difference between the rationales behind Figs. 1 and 2 and Supplementary Fig. 7. Figure 3a, c shows the co-benefit of per ton CO2 emission reduction and the damage of annual total emissions, respectively, from coal-fired plants located in each province; Fig. 3b, d presents the annual per capita loss and the total loss suffered by each province due to coal-fired power generation nationwide. As Fig. 3 shows, the provinces where the most polluting coal plants (inducing the highest losses) are located (Fig. 3a, c) are not necessarily the provinces that suffered the most (Fig. 3b, d). For instance, power plants in Hubei and Chongqing rank the second and the fourth in terms of the average damage, but their per capita losses rank 10th and 14th, respectively. In contrast, power plants in Anhui cause relatively small damages (ranks 20th nationally), but per capita loss in Anhui ranks the 6th. The orders of the total damages and losses in Fig. 3c, d show similar mismatches. The majority of previous studies on health costs of air pollution addressed the latter, namely estimating the losses suffered by affected regions16,17,20. However, from the perspective of energy policy targeting, it is more important to address the emission sources that induce the highest costs. Thus, it is arguable that results in Figs. 1 and 2 have more direct policy interpretations in energy planning and siting, as well as in carbon pricing and environmental tax policies.Fig. 3: The difference between health cost valuations based on emission sources vs. the affected regions.a Value of health co-benefit from reducing one ton CO2 emissions from coal-fired power plants located
https://www.nature.com/articles/s41467-021-27252-1
Location-specific co-benefits of carbon emissions reduction from coal-fired power plants in China