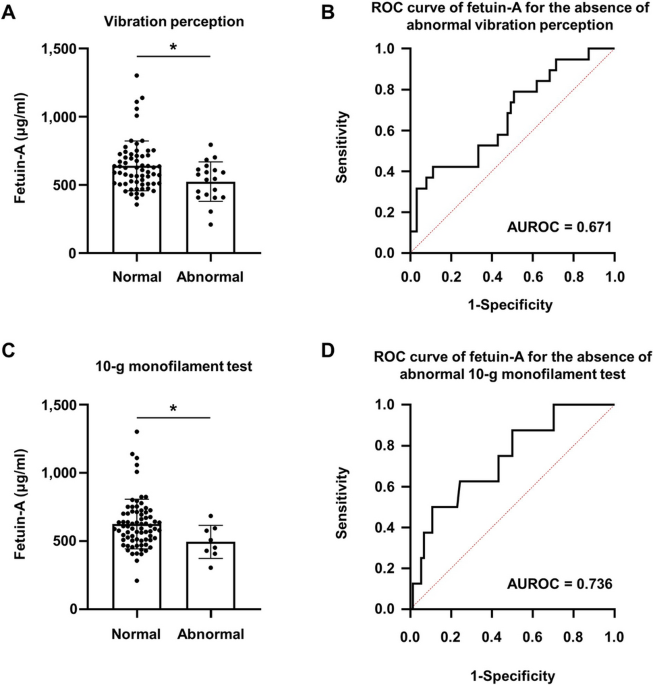
Liver fibrosis indices are related to diabetic peripheral neuropathy in individuals with type 2 diabetes Kyuho Kim1, Tae Jung Oh1,3, Hyen Chung Cho1, Yun Kyung Lee1, Chang Ho Ahn1,3, Bo Kyung Koo2,3, Jae Hoon Moon1,3, Sung Hee Choi1,3 & Hak Chul Jang1,3 Scientific Reports 11, Article number: 24372 (2021) Cite this article The association between nonalcoholic fatty liver (NAFL) or liver fibrosis and diabetic peripheral neuropathy (DPN) has not been well studied. We aimed to investigate the association of NAFL or liver fibrosis indices and DPN in individuals with type 2 diabetes. In this observational study, we included 264 individuals with type 2 diabetes, and calculated non-alcoholic fatty liver disease (NAFLD) liver fat score, NAFLD fibrosis score, and Fibrosis-4 (FIB-4) index to evaluate the status of NAFLD or liver fibrosis. DPN was diagnosed when the Michigan Neuropathy Screening Instrument—Physical Examination score was ≥ 2.5. The NAFLD fibrosis score and FIB-4 index were significantly higher in individuals with DPN than in those without DPN. Logistic analyses showed that the NAFLD fibrosis score and FIB-4 index were associated with DPN after adjustment for covariates (adjusted odds ratio 1.474 and 1.961, respectively). In the subgroup analysis, this association was only significant in the group with a high NAFLD liver fat score (> − 0.640). Serum levels of fetuin-A, a hepatokine, were decreased in individuals with abnormal vibration perception or 10-g monofilament tests compared with their counterparts. The present study suggests that liver fibrosis might be associated with DPN in individuals with type 2 diabetes. Nonalcoholic fatty liver disease (NAFLD) is the most prevalent chronic liver disease worldwide, affecting approximately 25% of the global population1. It encompasses a spectrum of diseases, extending from nonalcoholic fatty liver (NAFL) through nonalcoholic steatohepatitis (NASH), advanced fibrosis to cirrhosis, and end-stage liver disease. The natural history of NAFL is variable, with the majority of individuals having benign disease with steatosis without inflammation2. However, 40% of individuals with NAFL develop advanced fibrosis, which can result in cirrhosis3. The prevalence of NAFLD in individuals with type 2 diabetes is higher than that in the general population, ranging from 40 to 70%2. In addition, individuals with type 2 diabetes showed an increased risk of developing NASH, advanced fibrosis, and cirrhosis4,5,6,7. NAFLD in individuals with type 2 diabetes is associated with an increased risk of developing cardiovascular disease (CVD)8,9 and an increased risk of microvascular complications, such as nephropathy and retinopathy10,11,12.Diabetic peripheral neuropathy (DPN) is the most common form of diabetic neuropathy and affects approximately 50% of individuals with diabetes13. Risk factors for DPN include hypertension, smoking, hyperglycaemia, diabetes duration, age, dyslipidaemia, and obesity, which are also known risk factors for CVD14. Considering that NAFLD, CVD, and DPN share risk factors and that NAFLD is associated with an increased risk of other microvascular complications, it is reasonable to hypothesize that individuals with diabetes and NAFL or liver fibrosis would also have a high risk for DPN.In the present study, we examined the association of NAFL or liver fibrosis with DPN using noninvasive methods for evaluating NAFLD and liver fibrosis. In addition, we tested the association between DPN and fetuin-A, a hepatokine that is known to be elevated in individuals with NAFLD15.The present study included the data of 264 individuals with type 2 diabetes but without chronic liver diseases; 38.2% had DPN. Body mass index (BMI), fasting plasma glucose (FPG), haemoglobin A1c (HbA1c), and aspartate aminotransferase (AST) levels were significantly higher in individuals with DPN than in those without DPN (Table 1). The prevalence of suspected NAFLD based on NAFLD liver fat score > − 0.640 was compatible between individuals with and without DPN (73.3% vs. 69.3%, p = 0.493). However, both the NAFLD fibrosis score and Fibrosis-4 (FIB-4) index were significantly higher in individuals with DPN than in those without DPN.Table 1 Demographics of study participants according to the presence of DPN.We stratified individuals by NAFLD liver fat score (≤ − 0.640 or > − 0.640) and the presence of DPN. Compared with individuals with a low NAFLD liver fat score (≤ − 0.640), individuals with a high NAFLD liver fat score (> − 0.640) were more obese and had higher blood pressure (BP), triglyceride levels, AST, alanine aminotransferase (ALT), and homeostatic model assessment-insulin resistance (HOMA-IR) (Table 2). However, there were no significant differences in neuropathy examination results between individuals with a low NAFLD liver fat score (≤ − 0.640) and those with a high NAFLD liver fat score (> − 0.640). In contrast to the subgroup with a low NAFLD liver fat score (≤ − 0.640), the NAFLD fibrosis score and FIB-4 index were significantly higher in individuals with DPN than in those without DPN among individuals with a high NAFLD liver fat score (> − 0.640).Table 2 Clinical and biochemical characteristics of individuals with type 2 diabetes according to the NAFLD liver fat score and the presence of DPN.Association of NAFLD fibrosis score and FIB-4 index with DPNLogistic regression analyses showed that the NAFLD liver fat score was not associated with DPN. However, the NAFLD fibrosis score and FIB-4 index were significantly associated with DPN: adjusted odds ratio (aOR) 1.474 (95% confidence interval [CI] 1.055, 2.058), and aOR 1.961 (95% CI 1.209, 3.183), respectively (Table 3). In the subgroup analysis, this association was only observed in individuals with a high NAFLD liver fat score (> − 0.640). The aORs for the NAFLD fibrosis score and FIB-4 index were 1.501 (95% CI 1.006, 2.239) and 2.272 (95% CI 1.271, 4.059), respectively.Table 3 ORs between NAFLD liver fat score, NAFLD fibrosis score, FIB-4 index, and DPN.Association between fetuin-A and DPN featuresAmong individuals with a high NAFLD liver fat score (> − 0.640), serum fetuin-A levels were 613.5 ± 181.0 µg/ml in individuals without DPN and 611.3 ± 182.7 µg/ml in those with DPN (p = 0.956). Serum fetuin-A levels were significantly lower in individuals with abnormal vibration perception (542.2 ± 144.9 µg/ml vs. 639.0 ± 183.0 µg/ml, p = 0.014) and in those with an abnormal 10-g monofilament test (494.2 ± 121.0 µg/ml vs. 625.2 ± 182.1 µg/ml, p = 0.029) compared with their counterparts. The area under the receiver operating characteristic curve (AUROC) of the fetuin-A levels for the absence of abnormal vibration perception was 0.671 (95% CI 0.531, 0.811) and for the absence of abnormal 10-g monofilament test was 0.736 (95% CI 0.561, 0.911) (Fig. 1).Figure 1Serum fetuin-A levels and ROC curves for the detection of abnormalities in DPN examination in individuals with a high NAFLD liver fat score (≥ − 0.640). (A) Normal (n = 63) and abnormal (n = 19) vibration perception. (B) ROC curve of fetuin-A for the absence of abnormal vibration perception. (C) Normal (n = 74) and abnormal (n = 8) 10-g monofilament tests. (D) ROC curve of fetuin-A for the absence of an abnormal 10-g monofilament test. *p − 0.640). This can be explained by increased vulnerability of the liver to injuries such as oxidative stress or cytokines, as reflected by higher BMI, AST, ALT, and HOMA-IR levels in individuals with a high NAFLD liver fat score (> − 0.640) compared with those with low NAFLD liver fat score (≤ − 0.640).The ‘multiple hit hypothesis’ suggests that multiple insults might be generated in individuals with type 2 diabetes due to altered inter-organ crosstalk between the intestine, adipose tissue, skeletal muscle, liver, and pancreas, and that these insults would synergistically result in the development and progression of NAFLD20. During the development of NAFLD, hypercaloric diets can induce intestinal dysbiosis and excess fat storage in adipose tissue, skeletal muscle, and liver, which result in inflammation and insulin resistance. Insulin resistance results in hyperglycaemia and hyperinsulinaemia. During the progression of NAFLD, glucolipotoxicity increases reactive oxygen species (ROS) generation and endoplasmic reticulum stress, resulting in cell death. Together, these dead cells combined with infiltrated inflammatory cells in the liver, free fatty acids, intestine-derived lipopolysaccharides, and transforming growth factor (TGF)-β from Kupffer cells activate hepatic stellate cells (HSCs). Activated HSCs increase the extracellular matrix, leading to liver fibrosis. Among these insults related to the progression of NAFLD, hyperglycaemia, insulin resistance, oxidative stress, and inflammation are also involved in the pathogenesis of DPN21.Advanced glycation end products (AGEs) are implicated in the pathogenesis of DPN. The formation of AGEs increases under chronic hyperglycaemia in diabetes. Interaction of AGEs with their receptors (RAGEs) activates intracellular signalling pathways and increases oxidative stress and inflammation, ultimately resulting in neuronal injuries22,23. Interestingly, patients with NASH exhibited higher hepatic and serum glyceraldehyde-derived AGEs levels than those with simple steatosis or healthy controls24. In addition, glyceraldehyde-derived AGEs increase ROS generation and upregulate fibrogenic genes such as α-smooth muscle actin, TGF-β1, and collagen type Iα2 in human hepatic stellate cell line in vitro25. These results suggest that glyceraldehyde-derived AGEs may contribute to the pathogenesis of NASH. Considering the potential role of AGEs and RAGEs in the pathogenesis of both DPN and NAFLD, our finding that the NAFLD fibrosis score and FIB-4 index were associated with DPN appears reasonable.The progression of NAFLD alters the secretion of hepatokines such as fetuin-A, fetuin-B, and dipeptidyl peptidase-426,27, and we evaluated an association between fetuin-A and DPN. Serum fetuin-A levels were negatively associated with abnormal vibration perception and abnormal 10-g monofilament tests. Considering a previous study that showed TGF-β1 signalling suppression by fetuin-A28, and a previous study that showed high TGF-β1 levels in individuals with DPN29, our results seem to suggest a possibility of link between fetuin-A and DPN. Although, fetuin-A cannot be used as a diagnostic tool for DPN, this link suggests the possibility of loss of protection sensation.This study has several limitations. First, it cannot establish a causal relationship because of its cross-sectional nature. Second, liver biop
https://www.nature.com/articles/s41598-021-03870-z
Liver fibrosis indices are related to diabetic peripheral neuropathy in individuals with type 2 diabetes