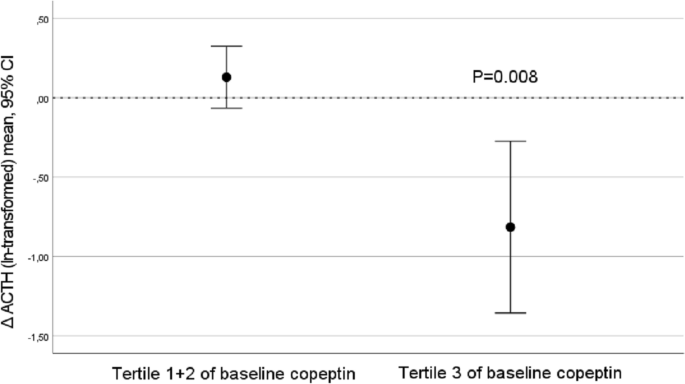
Investigation of possible underlying mechanisms behind water-induced glucose reduction in adults with high copeptin Elevated copeptin, a surrogate marker of vasopressin, is linked to low water intake and increased diabetes risk. Water supplementation in habitual low-drinkers with high copeptin significantly lowers both fasting plasma (fp) copeptin and glucose. This study aims at investigating possible underlying mechanisms. Thirty-one healthy adults with high copeptin (> 10.7 pmol·L−1 (men), > 6.1 pmol−1 (women)) and 24-h urine volume of 600 mOsm·kg−1 were included. The intervention consisted of addition of 1.5 L water daily for 6 weeks. Fp-adrenocorticotropic hormone (ACTH), fp-cortisol, 24-h urine cortisol, fasting and 2 h (post oral glucose) insulin and glucagon were not significantly affected by the water intervention. However, decreased (Δ baseline-6 weeks) fp-copeptin was significantly associated with Δfp-ACTH (r = 0.76, p 6.1 pmol L−1 in women and > 10.7 pmol L−1 in men), corresponding to the top quartile of copeptin in the population-based Malmö Diet and Cancer—Cardiovascular Cohort3, were eligible for the current pilot study. They were all previous participants of the Malmö Offspring Study, a population study in the Scania region of southern Sweden. In this cohort, plasma samples were obtained after an overnight fast between the years 2013–2015 and frozen at − 80 °C. Copeptin was measured in these plasma samples. We reached out to 277 individuals with high plasma copeptin with an invitation to participate in the current study. Out of these, 34 individuals were included. In addition to high copeptin and age range as specified above, inclusion criteria were laboratory findings that, together with high copeptin, indicated low water intake (24-h urine osmolality ≥ 600 mOsm · kg · L−1 water and 24-h urine volume ≤ 1.5 L). Exclusion criteria were as follows: pregnancy or breastfeeding; plasma sodium < 135 mM; use of diuretics, lithium, or selective serotonin reuptake inhibitors; chronic kidney disease (estimated glomerular filtration rate (eGFR) < 30 mL/min per 1.73 m2); heart failure; type 1 diabetes or type 2 diabetes treated with insulin; inflammatory bowel disease; and vulnerable persons (those with a legal guardian or loss of personal liberty). Thus, individuals with increased risk for hyponatremia (i.e., use of diuretics, lithium, or selective serotonin reuptake inhibitors; heart failure) were not eligible to participate for safety reasons. A detailed description of the recruitment and inclusion process of the pilot study can be found elsewhere25. The pilot study was designed to investigate the copeptin lowering effect from moderate water intake in low-drinkers, as well as to test study logistics, safety, compliance, and drop-out rate before the start of the long-term H2O Metabolism Trial. To reach these objectives, a sample size of ~ 30 individuals was judged to be satisfactory.All participants provided written informed consent before their inclusion in the study. The study was approved by the ethics committee of Lund University and performed in accordance with the ethical standards laid down in the 1964 Declaration of Helsinki and its later amendments.Study visits were performed at baseline and at the end of the 6-week intervention. Participants arrived at the clinic between 7:45 am and 9:15 am after an overnight fast. The study protocol was previously described in detail25. At the study visits, measurements of copeptin, glucose, glucagon, insulin, ACTH and cortisol were performed sitting in an upright position. Furthermore, the insulin and glucagon response to an oral glucose tolerance test (OGTT) was assessed after 120 min. At baseline and after 6 weeks, fluid and dietary intakes were assessed using a previously validated web-based 4-day record tool25,26.Participants collected 24-h urine samples the day before each study visit. Upon awakening, participants voided and discarded this first morning urine sample. All subsequent urine produced throughout the day and overnight was collected in a single container. The next morning, upon awakening, participants produced a final first morning void, which completed the 24-h collection. Participants delivered the complete, fresh 24-h urine samples to the clinic during their study visit that day. The 24-h urine collections followed procedures developed at the Department of Endocrinology, Skåne University Hospital Malmö, Sweden, and consisted of a comprehensible written instruction aimed at ensuring accurate and complete collection of urine.Laboratory measurementsFasting plasma (fp) copeptin concentration was measured by using a KRYPTOR Compact Plus device and commercially available chemiluminescence sandwich immunoassay copeptin ProAVP kit with coated tubes from samples stored at − 80 °C (BRAHMS Copeptin proAVP KRYPTOR; ThermoFisher Scientific). Plasma glucose, ACTH and cortisol, serum insulin and urine cortisol measurements were performed at the certified University Hospital's central clinical laboratory. Plasma glucagon concentration was measured at the Biomedical centre, Lund University, by using a commercially available immunoassay from samples stored at − 80 °C (Mercodia sandwich ELISA).StatisticsSignificance of differences between baseline and after intervention was tested using Wilcoxon paired rank test. Correlation coefficients between delta (Δ) values (difference in change between baseline and 6-week values) were determined by using Pearson correlation. Values of copeptin, ACTH and urine cortisol were ln-transformed before the Δ values were calculated to avoid non-normally distributed Δ values. Subjects were a posteriori divided into tertiles of baseline fp copeptin. Finally, significant differences in change of fp ACTH and urine cortisol were tested in subgroups defined based on baseline copeptin using one sample t test. SPSS statistical software version 26 (SPSS Inc., Chicago, Ill., USA) was used for all analyses. A 2-sided p value of 6.1 pmol·L−1 in women and > 10.7 pmol·L−1 in men), 277 were contacted, and 34 individuals were eligible and included in the study (82 were not reached, 93 were not interested and 38 were excluded; out of 64 qualified individuals, 30 could not be included due to either low urine osmolality or high urine volume). Three individuals dropped out during the intervention. In two cases the drop out was due to infections without any suspicion of link to the ongoing water intervention. In one case the drop out was for personal reasons. The mean age among the 31 individuals that completed the 6-week water intervention was 43 (min 22, max 66) years and 61% were men. As previously described, the anticipated extra 1.5 L of water per day during 6 weeks resulted in an achieved extra water intake and increased urine volume of around 1.2 L25.The impact of water on glucoregulatory hormonesThe 6-week water intervention did not result in any significant change in either fp ACTH, fp cortisol, fasting and 2 h-OGTT insulin or glucagon or urine cortisol concentrations (Table 1, Supplementary Fig. 1) in parallel with the previously described decrease in fp copeptin and fp glucose. However, the water-induced change in fp copeptin between baseline and 6 weeks significantly correlated with a water-induced change in fp ACTH and fp glucagon, respectively (Table 2). Change in fp copeptin (baseline—6 weeks) did not correlate with a change in any of the other measured glucoregulatory hormones (Table 2).Table 1 Measures of water intake, ACTH, cortisol, insulin and glucagon at baseline and after water intervention (n = 31).Table 2 Correlations between Δ change of copeptin (baseline—6 weeks) and Δ change of metabolic variables.Stratification in tertiles of baseline copeptinAs we previously found that participants in the top tertile of baseline copeptin had the best water-induced copeptin and glucose reduction, we stratified our population in tertiles of baseline copeptin, and found that in the top tertile, fp ACTH was reduced from a median of 13.0 (interquartile range 9.2–34.5) to 7.7 (5.3–9.9) pmol·L−1, p = 0.007, while no fp ACTH reduction was observed in the other copeptin tertiles (Fig. 1, Supplementary Table 1, Supplementary Fig. 1). Furthermore, a water-induced increase in urine cortisol was observed among individuals belonging to tertile 1 and 2 of baseline copeptin, while no such increase was observed in the top tertile of baseline copeptin (Supplementary Fig. 2). None of the other investigated glucoregulatory hormones were significantly affected by the intervention in any tertile of baseline copeptin (Supplementary Table 1).Figure 1ACTH reduction after water intervention was evident among individuals (n = 10) belonging to the top tertile of pilot baseline copeptin concentration.Correlation between glucose reduction and other glucoregulatory hormonesFinally, when investigating correlations between water-induced change in fp glucose (baseline—6 weeks) and change in other glucoregulatory hormones, we found that the water-induced change in fp glucose was significantly associated with water-induced change in fp cortisol, while there were borderline significant correlations between change in fp glucose and change in fp ACTH and 120 min insulin respectively (Table 3). Change in fp glucose did not correlate significantly with change in the other investigated glucoregulatory hormones (Table 3).Table 3 Correlations between Δ change after water treatment (baseline—6 weeks) of glucose and Δ change of other metabolic variables.The main finding of this study was that the copeptin reduction (Δ fp-copeptin) observed after the addition of 1.5L of water per day during the 6-week intervention significantly correlated with Δ fp-ACTH, pointing at a possible underlying mechanism behind the glucose reduction previously observed in the same study upon water treatment. Fp-ACTH reduction was observed only in the one-third of the participants with the highest baseline copeptin concentration. As described in our previous publication25, there were no changes in weight or dietary intake (except from increased water intake) between baseline and after 6 weeks that could possibly explain our results. Additionally, there were no differences between
https://www.nature.com/articles/s41598-021-04224-5
Investigation of possible underlying mechanisms behind water-induced glucose reduction in adults with high copeptin