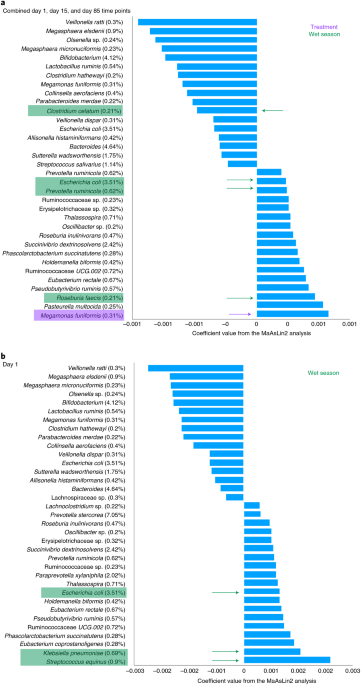
Gut microbiomes from Gambian infants reveal the development of a non-industrialized Prevotella-based trophic network Marcus C. de Goffau1,2 na1, Amadou T. Jallow3 na1, Chilel Sanyang3, Andrew M. Prentice orcid.org/0000-0001-5389-451X3, Niamh Meagher4,5, David J. Price4,5, Peter A. Revill6, Julian Parkhill orcid.org/0000-0002-7069-59587, Dora I. A. Pereira3,8 na1 & Josef Wagner orcid.org/0000-0003-1204-77651,6 na1 Nature Microbiology (2021)Cite this article Microbial ecologyMicrobiome Distinct bacterial trophic networks exist in the gut microbiota of individuals in industrialized and non-industrialized countries. In particular, non-industrialized gut microbiomes tend to be enriched with Prevotella species. To study the development of these Prevotella-rich compositions, we investigated the gut microbiota of children aged between 7 and 37 months living in rural Gambia (616 children, 1,389 stool samples, stratified by 3-month age groups). These infants, who typically eat a high-fibre, low-protein diet, were part of a double-blind, randomized iron intervention trial (NCT02941081) and here we report the secondary outcome. We found that child age was the largest discriminating factor between samples and that anthropometric indices (collection time points, season, geographic collection site, and iron supplementation) did not significantly influence the gut microbiome. Prevotella copri, Faecalibacterium prausnitzii and Prevotella stercorea were, on average, the most abundant species in these 1,389 samples (35%, 11% and 7%, respectively). Distinct bacterial trophic network clusters were identified, centred around either P. stercorea or F. prausnitzii and were found to develop steadily with age, whereas P. copri, independently of other species, rapidly became dominant after weaning. This dataset, set within a critical gut microbial developmental time frame, provides insights into the development of Prevotella-rich gut microbiomes, which are typically understudied and are underrepresented in western populations. Development of the gut microbiome in infants (aged 0 to 1 year) and toddlers (aged 1–3 years) has been an area of intense research but has mainly focused on European and US populations. Development of the infant gut microbiota in pre-industrial populations is therefore of interest. Several important studies have shown that pre-industrial microbiotas are dominated by Prevotella, a genus whose abundance is much lower in industrial and westernized nations where Bacteroides is typically much more dominant. A well-known example of this is the study by Yatsunenko et al. in which they compared healthy Amerindians from the Amazonas of Venezuela, residents of rural Malawian communities and inhabitants of metropolitan areas in the USA1. This study found that the most distinguishing difference between Americans and either pre-industrial group was the Prevotella/Bacteroides ratio. The same was also found when comparing children in West Africa (Burkina Faso) and Europe (Italy)2. Other studies from Malawi3 and Nigeria4 studying rural populations similarly confirmed the high abundance of Prevotella.An interesting concept within the human gut microbiome is the enterotype hypothesis which clusters the gut microbiome compositions of individuals, from a simplified point of view, into those dominated by Bacteroides, Ruminococcaceae or Prevotella5,6. In industrialized countries, the Bacteroides and Ruminococcaceae enterotypes are typically common, whereas the Prevotella enterotype is more commonly detected in countries with pre-industrialized lifestyles7,8 or in people with a more plant-based diet (vegetarians). Although the concept of enterotypes remains controversial, most agree that the abundance of Prevotella is one of the most discriminative factors when comparing various microbial compositions.In the current study, we utilized data from an iron intervention trial in The Gambia, West Africa9. Consisting of 616 children, this is the largest paediatric cohort studied thus far in a critical time window for gut microbiome development (7 to 37 months) in a non-industrialized environment. This exploratory study provides important insights into the development of trophic networks in individuals whose gut microbiome is dominated by Prevotella. Bacterial trophic networks can be understood as microbial populations that form clusters and, at the trophic level, constitute a food web of metabolically interdependent organisms10,11. To date, such analyses have been performed mostly on Prevotella-poor cohorts from industrialized countries using combinations of adults and children, or to some degree, on smaller paediatric groups in non-industrialized countries12. Information about the study setting for the iron intervention trial and additional nutritional and dietary information can be found in the Methods.We performed 16S ribosomal RNA amplification and sequencing on a total of 1,546 faecal samples from a secondary study outcome as a part of a double-blind, randomized iron intervention trial (NCT02941081) in The Gambia. A flow diagram (Supplementary Information) shows the samples taken for the secondary study outcome.After quality filtering and applying exclusion criteria, 1,389 samples remained. A detailed description of the participants, exclusion criteria and sampling framework is available in the Methods. Children were enroled between the ages of 7 and 37 months, and samples were collected at three different time points (day 1, day 15 and day 85) during an iron intervention trial in The Gambia9 (see Extended Data Table 1 for additional details). The children were initially split into three age groups (7 to <12 months, 12 to <24 months and 24 to 37 months at the time of enrolment) and subsequently analysed in detail in 11 age groups.Justification for combining treatment and placebo groupsMultivariate and univariate analyses were conducted to identify whether children from the treatment arm (iron supplementation) and from the placebo group could be analysed together. Multidimensional scaling using principal coordinates analysis (PCoA) did not cluster children differently based on treatment at the individual time point (Supplementary Fig. 1a–c) or in the combined time point analysis (Supplementary Fig. 1a–d). Volcano plot analysis identified one species that was statistically different between the two sample groups (red dot in Supplementary Fig. 1e). The higher abundance in the treatment group of this single species, Megamonas funiformis, was subsequently confirmed by the Kruskal–Wallis rank test with a false discovery rate (FDR) corrected P value of 0.01 (Supplementary Table 1). ‘ALDEx2' did not identify any other taxa as statistically significantly different (Supplementary Table 1). Because the bacterial compositions between both groups were highly similar, as is also shown in subsequent sections in regards to other aspects such as diversity, we subsequently analysed all samples together as one group. Thus, although this gut microbiome dataset does not inform on the controlled trial aspects of the original study, it does represent an excellent opportunity for understanding gut microbiome development over time in these African children.Alpha-diversity increase over time from 7 to 40 months of ageThe alpha-diversity indexes for Fisher's alpha parameter, Simpson's index, Chao1 richness index and Richness index (observed richness) were not significantly different between the treatment and placebo group (Extended Data Fig. 1). To follow alpha-diversity changes over time in the whole data set, we split the data into 11 age groups, separated by 3-month intervals based on the age group at sampling. Fisher's alpha parameter indicated a statistically significant increase in alpha-diversity from the youngest age group (7–9 months) to the oldest (37–40 months) age group (Kruskal–Wallis P < 0.0001) and a gradual increase in between (Extended Data Fig. 2). Individual time point analysis also highlights the higher robustness of Fisher's alpha index (Extended Data Fig. 3). Additional information about other alpha-diversity indexes are presented in the Supplementary Information (alpha- and beta-diversity sections).Beta-diversity differs between age groupsThe PCoA of the gut microbiome stratified into three age group (7–12 months, 1–2 years and 2+ years, age taken at time of sampling) showed distinctive clusters with the youngest and oldest groups separated most from each other (Extended Data Fig. 4a–d). The Bonferroni corrected P value from the permutational multivariate analysis of variance (PERMANOVA) test and analysis of similarities (ANOSIM) test between the three different age groups was 0.0003 (Extended Data Table 2). Additional PCoA and PERMANOVA and ANOSIM tests for the 11 age group comparisons (Extended Data Fig. 5a–d), gender, geographic locations and season are presented in the Supplementary Information (alpha- and beta-diversity sections).Multivariable analysis to identify taxa associated with age, season and iron treatmentThe R package MaAsLin2 was used to find taxa significantly associated with age, season (wet or dry) and treatment group. In the combined time point analysis, the individual subject identifier was used as a random effect to account for repeat sampling of participants. We also analysed the three individual time points separately. All statistically significant taxa (q value <0.05) are shown in Supplementary Table 5. The top associated taxa (coloured in Supplementary Table 5) with a minimum abundance of 0.2% are further discussed below.In the combined time point analysis, 16 taxa were negatively associated with increasing age including Bifidobacterium, Bacteroides, Escherichia coli, Sutterella wadsworthensis and Streptococcus salivarius, which were all taxa in the top ten most abundant species with a minimum abundance of 1%. Thirteen taxa were positively associated with age, with Succinivibrio dextrinosolvens, Ruminococcaceae UCG.002, Thalassospira, Eubacterium rectale and Prevotella ruminicola being the most positively associated (Fig. 1a). The combined time point analysis also confirmed that Megamonas funiformis was associated with iron supplementation (purple arrow in Fig. 1a) yet this association disappeared when analysing day 1, day 15 or day 85 samples separately (Supplementary Table 5). One species (Clostridium celatum) was negatively and three species (P. ruminicola, E. coli and Roseburia faecis) were positively associated with the wet season (green arrows in Fig. 1a). In the day 15 and day 85 cohorts no taxa with a minimum abundance of 0.2% were associated with season or treatment (Supplementary Table 5), whereas in the day 1 cohort three taxa were associated with the wet season including E. coli, Streptococcus equinus and Klebsiella pneumoniae (Fig. 1b).Fig. 1: Multivariable statistical analysis to identify taxa associated with age, season and treatment group.a,b Taxa with a minimum abundance of 0.2% and FDR-corrected P value 2 years old age group compared with the 7–12 months age group (Extended Data Fig. 6).A detailed presentation of the top ten taxa with a minimum abundance of 1% showing changes between day 1, day 15 and day 85 in the young, middle and old age groups are shown in Fig. 2. Of the top ten taxa, five increased in abundance over time including the top three most abundant taxa, Prevotella copri (35.2%), Faecalibacterium prausnitzii (11.4%) and Prevotella stercorea (7.1%), as well as Succinivibrio dextrinosolvens and Paraprevotella xylaniphila. Five taxa decreased over time including the next three most abundant, Bacteroides (4.6%), Bifidobacterium (4.1%) and E. coli (3.5%) as well as Sutterella wadsworthensis and Streptococcus salivarius.Fig. 2: Top ten taxa with a minimum abundance of 1% across the young, middle and old groups.Top ten taxa with a minimum abundance of 1% identified through mixed-effect linear regression associated with the three age groups stratified by the three sampling time point. Relative abundances (%) are plotted on the y axis and the taxa across the three different sampling time points are plotted on the x axis. D, day.Visualization of the maturation of the gut microbiomeScatterplots of the ten most abundant taxa across the 11 3-month age groups visualize how all of these taxa either increase or decrease significantly in abundance over time (Fig. 3). Five of these taxa (58% of all reads) increased significantly over time, including P. copri (35.2%), F. prausnitzii (11.4%), P. stercorea (7.1%), Succinivibrio dextrinosolvens (2.4%) and Paraprevotella xylaniphila (2%). The other five taxa (15% of all 16S reads) decreased significantly over time, including Bacteroides (4.6%), Bifidobacterium (4.1%), E. coli (3.5%), Sutterella wadsworthensis (1.8%) and Streptococcus salivarius (1.1%). Prevotella copri, the most abundant bacterium, reached a stable level shortly after 1 year. Faecalibacterium prausnitzii, the second most abundant bacterium, reached a stable level a few months later. The most significant decrease in abundance was observed for Bifidobacterium, which assumedly had already begun to decrease in abundance before the age of 7 months as a result of weaning, but continued to decrease rapidly reaching a steady low state at approximately 2 years.Fig. 3: Top ten species with a minimum abundance of 1%, significantly associated in the 11 age groups.Significantly differentially abundant bacterial taxa on the TSS + CSS log2 data. The box plot shows the minimum, first quartile, median, third quartile and maximum values. The P value from the Kruskal–Wallis test shows the overall significance across all eleven 3-month age groups. In this overall general presentation, all three sampling time points were combined.In a second analysis, we plotted the bacterial taxa most strongly associated with age according to MaAsLin2 analysis (Supplementary Table 5) with a minimum abundance of 0.2%, stratified by the eleven 3-month age groups. In the combined analysis, the individual sampling time points were used as a random effect (Fig. 4). Strikingly, many of the taxa positively associated with age (Fig. 4a) increase steadily in number at similar rates, at least during the first 2 years of life, whereas the rates of decrease in those species negatively associated with age (Fig. 4b) appear less concord
https://www.nature.com/articles/s41564-021-01023-6
Gut microbiomes from Gambian infants reveal the development of a non-industrialized Prevotella-based trophic network