Population structure, genomic analysis, and patient demographics
A total of 3432 M. tuberculosis genomes from Lima (Peru) were analyzed, of which 3135 passed genomic quality filters. Of this, 2037 were part of a population level study carried out in 2009 where sputum samples were taken from all patients presenting tuberculosis symptoms in the Lima areas of Callao and Lima South23 (Supplementary Data File 1). Comparison of drug resistance prevalence between the population level sampling using molecular genotyping and reports of epidemiological data in Peru2 are consistent: 1.5% (32/2037) of samples were rifampicin mono-resistant; 5% were isoniazid mono-resistant (105/2037), and 13% were multidrug-resistant (251/2037) (Supplementary Table 1). The remaining samples were collected from cohort studies covering a 17-year period of research in the regions of Lima and Callao in order to achieve a sufficient temporal span in our sampling window (Supplementary Fig. 1). Both lineage 2 and lineage 4 had a similar distribution of sampling dates (Supplementary Fig. 2).
The isolates were first aligned to the reference genome H37Rv, then lineages and sublineages were assigned using clade specific SNPs24. Lineage 4 (L4, Euro-American) consisted of 2807 samples, while lineage 2 (L2, Beijing) had 327 isolates (Table 1). There was a single representative of lineage 1 (Indo-Oceanic), which was used to root the phylogenetic tree. The remaining samples from the data set, which included 5 M. caprae isolates, were not used in the downstream analysis. Lineage 4 had the highest diversity, comprising 1235 isolates from lineage 4.3 (LAM), 935 from lineage 4.1.2.1 (Haarlem), 271 from lineage 4.1.1 (X-Type), and 312 from lineages denoted as Type T, which encompasses lineages 4.5, 4.7, 4.8 and 4.9. Other minor sublineages included lineage 4.2.2 (TUR) and lineage 4.4. All isolates from Lineage 2 were part of the Beijing sublineage (lineage 2.2), mainly from the sublineage 2.2.1 or Modern Beijing, and with only one representative of the sublineage 2.2.2 or Asia Ancestral25 (Table 1).
Table 1 Population structure. Full size table
The alignment of the isolates to the reference genome resulted in 64,586 SNPs, of which 18,022 were singletons (28%). Most SNPs were not widely distributed across the population, and only 8088 variants had a frequency in the dataset higher than 1%. A total of 59,789 SNPs (16,934 singletons, 28%) were identified for lineage 4, and 4821 SNPs (1370 singletons, 28%) for lineage 2. We applied the same analysis to a publicly available data set of 1027 isolates from Samara, Russia, as a validation set where, unlike the Peruvian dataset, lineage 2 constitutes the main lineage. We identified a total of 28,414 SNPs, consistent with previous publications of this data19.
Patient demographic metadata was available for 2220 samples, of which 88% were smear positive, 27% were previously treated for tuberculosis, and 2.8% were HIV positive, consistent with previous population level estimates in Peru26. The median age was 28 years (IQR 21–41). In our cohort, 86% of lineage 2 and 89% of lineage 4 were smear positive.
Phylogenetic analysis and drug resistance emergence
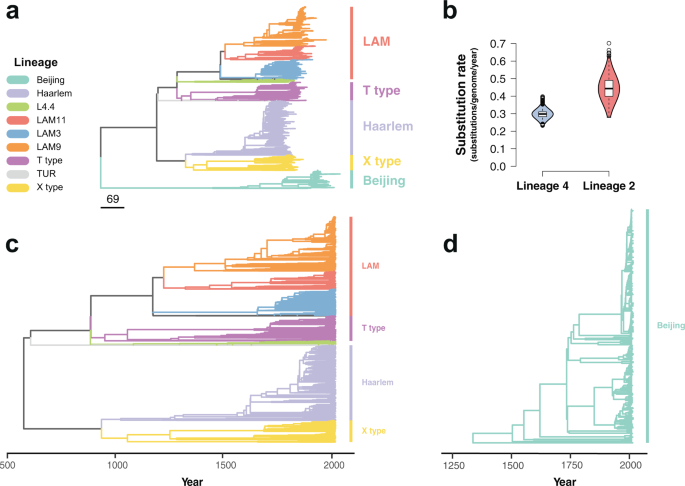
The maximum likelihood phylogeny constructed using these alignments grouped the isolates by lineage similarly to previously published global data sets24 (Fig. 1a, Supplementary Fig. 3). To study the temporal dynamics of drug resistance acquisition at the population level, the maximum likelihood phylogeny was time-calibrated using the sampling dates of the isolates, which extended from 1999 to 2016. Dated phylogenies were built separately for lineage 2 and lineage 4 in order to avoid the confounding effect of the temporal and population structures27. Before time calibration of the phylogeny, we tested the adequacy of the temporal correlation of evolutionary change to reliably infer the model parameters. First, a root-to-tip linear regression of the number of substitutions from the root and the sampling times was fitted to confirm a positive association between time and evolutionary change. As uneven sampling may bias the root-to-tip regression28, a date-randomization test was additionally performed using the full Bayesian model implemented in BactDating29 with the original dataset and 100 randomizations where the sampling times were permuted, representing the expectations of the model parameters in the absence of temporal signal. The substitution rate estimated for the original dataset and for the 100 randomizations was compared to verify a lack of overlap between the 95% credible intervals. Both lineage 4 and lineage 2 datasets showed a clear temporal signal (Supplementary Fig. 4), and thus model parameters could be confidently inferred from the data30,31. We used the relaxed clock model implemented in BactDating29, allowing the mutation rate to vary in each branch independently. We ran the MCMC until convergence of the chains was achieved, with an effective sample size (ESS) of at least 100 (Supplementary Fig. 5). The estimated rate for lineage 2 was 0.45 substitutions per genome per year (0.32–0.57 95% CI), while lineage 4 had a clock rate of 0.299 (0.25–0.36 95% CI) (Fig. 1b). The estimates of the molecular clock for both lineages were consistent with previous reports32. The most common recent ancestor (tMRCA) for our samples was placed at 565 CE (263;826 95% CI) for lineage 4 (Fig. 1c), while lineage 2 had a tMRCA in 1325 CE (1070;1499 95% CI) (Fig. 1d).
Fig. 1: Phylogenetic analysis of 3134 Mycobacterium tuberculosis isolates from Lima, Peru. Colors represent different lineages and sublineages. a Maximum likelihood phylogeny. Scale in number of substitutions per genome. b Violin plots showing the posterior density distribution of the inferred substitution rate in substitutions per genome per year derived by sampling from 107 MCMC iterations. The substitution rate was estimated separately for lineage 4 (blue) and lineage 2 (red). Box plots inside the violin indicate the median value of the distribution (black horizontal line) and the interquartile range. Whiskers denote 1.5x the interquartile range, while outliers are plotted as individual points. c Time-calibrated phylogeny of lineage 4. d Time-calibrated phylogeny of lineage 2. Full size image
Drug resistance was inferred for all isolates at the tips of the phylogenetic tree using well-established drug resistance associated SNPs33. In addition to molecular typing of drug resistance, all isolates included in the analysis had Drug Susceptibility Testing (DST) performed either by MODS or by the proportional method in agar. DST and molecular typing showed consistent results for 96% of the samples for rifampicin resistance and 92% for isoniazid resistance. The time of emergence of drug resistant mutations was inferred by reconstructing the ancestral sequences of the internal nodes in the phylogenetic tree. The time of emergence of a specific antibiotic resistance mutation was approximated to the inferred year of the internal node where such mutation first appeared. The phylogenetic estimates of the emergence of drug resistance conferring mutations in lineage 4 occurred around the time of the known introductions of the corresponding drug. In contrast the emergence of drug resistance in lineage 2 was observed to have arisen many years after the introduction of antituberculous drugs. This is consistent with the geographic spread of lineage 4 in Europe together with early widespread use of drugs in this region (Table 2, Fig. 2). For both lineage 2 and lineage 4, the earliest inferred occurrence of resistance was to isoniazid, by the Ser315Thr mutation in the gene KatG, around 1957 (1928;1978 95% CI) for lineage 2, and 1942 (1913;1960 95% CI) for lineage 4, in line with the reported wide introduction of isoniazid in 195234. The rifamycins were first isolated in 195734, and we estimate the date for the first acquisition of resistance to rifampicin due to the rpoB mutation Ser450Leu to have emerged around 1951 (1931;1971 95% CI) for lineage 4 and 1974 (1953;1988 95% CI) for lineage 2. None of the drug resistant nodes reverted to susceptible along the branches of the two phylogenetic trees.
Table 2 First emergence of drug resistance conferring mutations in Lima, Peru. Full size table
Fig. 2: Inferred posterior density distribution of the earliest occurrence of resistance to first line antituberculous drugs. Posterior density distribution inferred using a time-calibrated phylogeny for both lineage 4 and lineage 2. Arrows represent the approximate time of antibiotic introduction. Full size image
The emergence of compensatory mutations
It has been shown that secondary mutations arising after the acquisition of drug resistance may alleviate the fitness cost associated to antibiotic resistance mutations35, but little is known about their temporal dynamics. Data on M. tuberculosis drug resistance compensatory mechanisms is mainly limited to isoniazid and rifampicin resistance36,37. Non-synonymous mutations in the gene rpoC have been suggested as secondary compensatory mutations for rifampicin associated mutations in the rpoB gene37. A total of 34% (258/755) of lineage 4 isolates harboring rpoB mutations also had rpoC non-synonymous polymorphisms; for lineage 2, 38% (33/87) of isolates with rpoB mutations carried rpoC polymorphisms. No significant differences were observed between lineages in a logistic regression model (OR = 0.85, 95% CI 0.54–1.35, p-value = 0.49). Overall, 62% of rifampicin resistant isolates carried Ser450Leu rpoB mutations (525/842). Rifampicin resistant isolates harboring Ser450Leu rpoB mutations had a higher probability of carrying mutations in the rpoC gene (52%, 272/525) than isolates with other rpoB mutations (6%, 19/317) in a logistic regression model (OR = 16.86, 95% CI 10.55–28.50, p-value = 4 × 10⁻²⁹). Only 3% (9/291) of the isolates carried two non-synonymous mutations in the rpoC gene, while the rest had only one.
To understand the emergence of rpoC non-synonymous mutations, we scanned the phylogenetic branches of rifampicin resistant isolates from the root to the tip, using the inferred sequences of the ancestral nodes to determine the time of emergence of rpoC non-synonymous mutations. The analysis was repeated in 100 bootstrap phylogenies to infer confidence values around our estimates. In both lineage 2 and lineage 4, the emergence of rpoC non-synonymous mutations occurred immediately after or at the same time as the emergence of rifampicin resistance, and continued steadily over time (Fig. 3). For lineage 2, there was not a single emergence of rpoC mutations occurring prior to the rifampicin resistance conferring mutations. In the case of lineage 4, two rpoC mutations emerged before rifampicin resistance: c.765150 G > A and c.765590 C > A. Both mutations appeared once independently in the entire phylogeny. The mutation c.765150 G > A emerged in our dataset around the year 936 CE (727;1110 95% CI), in the MRCA of the clades X-type and Haarlem, all of which present the c.765150 G > A mutation (1206/2807 isolates). For c.765590 C > A, the estimated year of emergence was around 1867 CE (1813;1907 95% CI), and all the tips harboring the mutation belonged to a cluster of isolates part of the LAM11 sublineage (33/2807 isolates). Given that both mutations showed a clear phylogenetic structure and emerged independently only once in our dataset, they were considered phylogenetic mutations and were removed from the final analysis. The emergence of non-synonymous mutations in the rpoC gene was similar for isolates carrying the Ser450Leu rpoB mutation and for those isolates with other rpoB mutations (Supplementary Fig. 6).
Fig. 3: Dynamics of non-synonymous mutations in rpoC. a, b Cumulative number of non-synonymous mutations in rpoC over time. The x-axis represents the years since the inferred time of rifampcin resistance (time 0). Dark blue line shows the cumulative number of mutations for the ML tree, while the 95% confidence interval (shaded area) is inferred by repeating the analysis in 100 bootstrap phylogenies. The analysis was performed separately for a lineage 2 and b lineage 4. Full size image
Phylogeographic history of Mycobacterium tuberculosis in Peru
To estimate the year of M. tuberculosis introductions to Peru, we subsampled the Peruvian isolates and analyzed them alongside global representatives of both lineage 2 and lineage 4 for which both collection date and geographic origin were known (Supplementary Data File 2). The phylogenies were time-calibrated using a relaxed clock model as implemented in BactDating29, and MCMC convergence was assessed using the traces of the model parameters (Supplementary Fig. 7).
The phylogeographic history was inferred by reconstructing the ancestral states by maximum likelihood. The geographical origin of the isolates was treated as a discrete character, and we assumed that the time of introduction occurred at the first Peruvian node of each clade.
Two early introductions of lineage 2 from China in 1880 (1856;1905 95% CI) and 1906 (1881;1929 95% CI) accounted for 84% of the Peruvian dataset (275/327 isolates), and 77% (90/117) of the drug resistance isolates as well as 77% (20/26) of the independent resistance evolutionary events (Fig. 4a). Later introductions to Peru from China occurred between 1981 (1969;1989 95% CI) and 2004 (1999;2007 95% CI), with one introduction in 1986 (1974;1994 95% CI) from South Asia representing 6 isolates, one of which is drug resistant.
Fig. 4: Phylogeographic analysis of Mycobacterium tuberculosis introductions to Peru. a, b Inferred introductions of Mycobacterium tuberculosis in Peru. The top part shows a time-calibrated phylogeny, with inferred introductions to Peru highlighted in the nodes with colors representing the country from which the clade was introduced. Peruvian clades are shown in blue. The bottom part shows the estimated year of introduction. The analysis was done separately for a lineage 2 and b lineage 4. For visual representation purposes, only the year of introduction of clades with more than 10 tips are shown for lineage 4. Full size image
Lineage 4 was inferred to have been introduced in Peru several times over the years, mainly from Europe and Brazil (Fig. 4b). Lineage 4.3 (LAM) represents the first and main introduction from Brazil around 1512 (1383;1598 95% CI), shortly after the well documented arrival of the Europeans to the continent. Subsequent smaller introductions from Europe and Brazil around 1644 (1545;1713 95% CI) and 1743 (1671;1796 95% CI) shaped the LAM and T type lineages. We inferred that most of L4.1.2.1, part of the Haarlem sublineage, likely evolved from two introductions from Europe around 1693 (1614;1749 95% CI) and 1834 (1781;1869 95% CI). The most likely introductions of the X type clade (L4.1.1) occurred from Brazil in 1692 (1597;1754 95% CI) and South Africa for L4.1.1.3 in 1706 (1615;1773 95
https://www.nature.com/articles/s41467-021-27616-7