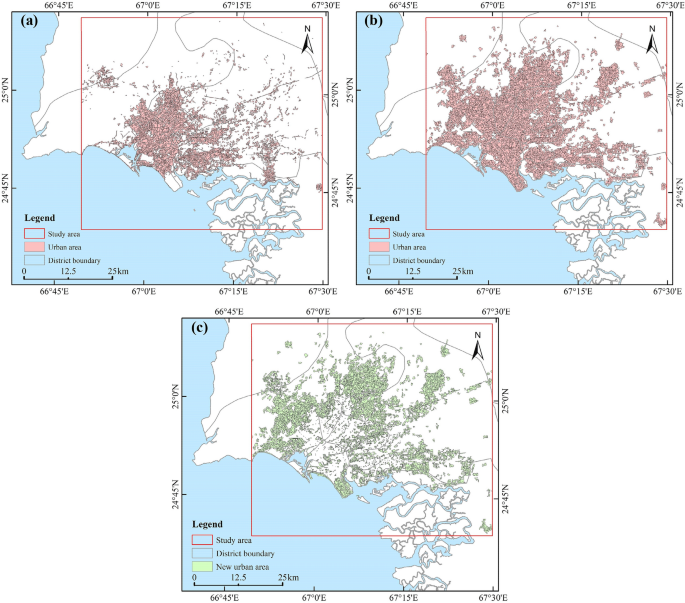
Dynamic monitoring of urban built-up object expansion trajectories in Karachi, Pakistan with time series images and the LandTrendr algorithm In the complex process of urbanization, retrieving its dynamic expansion trajectories with an efficient method is challenging, especially for urban regions that are not clearly distinguished from the surroundings in arid regions. In this study, we propose a framework for extracting spatiotemporal change information on urban disturbances. First, the urban built-up object areas in 2000 and 2020 were obtained using object-oriented segmentation method. Second, we applied LandTrendr (LT) algorithm and multiple bands/indices to extract annual spatiotemporal information. This process was implemented effectively with the support of the cloud computing platform of Earth Observation big data. The overall accuracy of time information extraction, the kappa coefficient, and average detection error were 83.76%, 0.79, and 0.57 a, respectively. These results show that Karachi expanded continuously during 2000–2020, with an average annual growth rate of 4.7%. However, this expansion was not spatiotemporally balanced. The coastal area developed quickly within a shorter duration, whereas the main newly added urban regions locate in the northern and eastern inland areas. This study demonstrated an effective framework for extract the dynamic spatiotemporal change information of urban built-up objects and substantially eliminate the salt-and-pepper effect based on pixel detection. Methods used in our study are of general promotion significance in the monitoring of other disturbances caused by natural or human activities. Urban expansion is one of the influences of human social and economic development, and it usually attracts a large concentration of population, resources, and energy1,2. From 2001 to 2018, the total area of global cities increased by 1.68 times to 802,233 km23. Although the total urban area accounts for only 0.54% of the land surface area3, previous studies have shown that rapid urbanization has introduced problems, such as changes in the local climate, fragmented habitats, degradation of land ecological function, and reduction of arable land, forests, and grasslands2,4. In particular, urban expansion in some countries and regions has taken up large areas of high-quality arable land and grassland, which also hinders the achievement of the second Sustainable Development Goal (SDG 2, Zero Hunger) established by the United Nations5,6. Therefore, continuous monitoring of urban expansion is of great significance in understanding the process of urbanization, analyzing the impact of urbanization on the ecological environment, and planning future cities. The timely change mapping of urban expansion is very important for decision-making for the adjustment of urban management policies and the planning of urban functional layouts.Traditional methods for monitoring urban expansion are urban land use/cover classification and mapping, which provide important spatiotemporal insights for understanding urban expansion at a regional scale7,8. Classification and mapping methods are either based on post-classification comparisons, or a pixel-to-pixel approach for the simultaneous analysis of multispectral patterns in two or more time-series images9. Owing to the lack of remote sensing image resources, time-consuming processes, and limited computing capabilities10, these methods are mainly used for urbanization monitoring in 5 or 10 years period, and it is difficult to show the dynamic changes on a yearly scale. At the same time, these monitoring methods are based on the interpretation of multi-phase remote sensing images, with extensive manual interpretation and classification, which may lead to the accumulation and propagation of classification errors11,12.With the development of remote sensing technology, time-series imagery combined with Earth Observation (EO) big data cloud computing platform can effectively solve these problems and achieve efficient and low-cost continuous monitoring of urban expansion. EO big data have been accumulating for nearly 50 years since the implementation of several EO projects in the 1970s. The United States Geological Survey has developed research-quality, application-ready science products derived from original Landsat data13, which can be used to monitor, assess, and analyze urban expansion on the Google Earth Engine (GEE) platform. GEE is a representative remote sensing cloud computing platform that allows users to implement EO big data storage, management, and spatial analysis using Google infrastructure14. These advantages of cloud-based platforms provide an opportunity to monitor quickly and efficiently and continually land disturbances associated with urban expansion.The change detection algorithm is a state-of-the-art method used for continuous urban expansion. It includes mutation detection and gradient detection algorithm. Mutation detection algorithms includes sub-annual change detection15, image trends from regression analysis16, exponentially weighted moving average change detection17, vegetation change tracker18, breaks for additive seasonal and trend19, and vegetation regeneration and disturbance estimates over time20, which are often used to monitor forest fires, deforestation, and seasonal floods. The gradient detection algorithm include continuous change detection and classification21, continuous monitoring of land disturbance22, and LT (LandTrendr) algorithm23, which are frequently used in scenes of gradual change, such as land degradation and urban expansion. Among them, the LT algorithm can analyze the gain or loss trend of discrete points and shows an excellent performance for extracting the spatial and temporal information of urban expansion23. However, LT still faces two challenges in the extraction of spatiotemporal information of urban expansion: (1) Most of the land cover types around cities in arid areas are bare land. The similar spectral and texture information makes urban expansion monitoring more difficult; (2) LT change detection algorithms are pixel-based and produce a salt-and-pepper effect in the results of detecting spatiotemporal information24. The salt-and-pepper effect is an uncertain and random phenomenon in the processing process. Isolated pixels with high local spatial heterogeneity between adjacent pixels appear in the results. They are considered to be noise that affects the accuracy and visibility of classification results25. The traditional processing method is spatial filtering26, but this simple processing increases the possibility of loss of important information27.Therefore, this study aims to propose a new monitoring framework to achieve the following objectives: (1) To studying a method suitable for extracting urban expansion information in arid areas based on the GEE platform and LT algorithm, combined with multiple indices/bands. (2) To eliminating the widespread phenomenon of salt-and-pepper in previous studies. (3) To using this research to provide a method for the continuous monitoring of urban expansion and even other natural or man-made induced interference.The urban built-up areas in 2000 and 2020 were obtained using object-oriented segmentation and setting classification rules. Figure 1 shows the spatial patterns of a total of 3113 and 6895 urban built-up objects from the years 2000 and 2020, covering 456.08 km2 and 1117.29 km2, respectively. We use the ‘Erase tool’ to remove the 2000 results from the 2020 results in ArcMap, and obtain the changes in Karachi from 2000 to 2020. We observed that there were 3782 new urban built-up areas in the span of 21 years, covering an area of 661.21 km2 (Fig. 1c).Figure 1(a) Urban areas in 2000; (b) urban areas in 2020; (c) new urban areas extracted using the object-oriented method (2000–2020). The map created in ESRI ArcMap 10.2 (https://support.esri.com/zh-cn/products/desktop/arcgis-desktop/arcmap/10-2-2).Historical change trajectory of urban expansionAnnual urban changes analysisFigure 2 shows the urban annual change trajectory of Karachi from 2000 to 2020. The spatial and temporal distribution of urban change over these 21 years is shown using gradient mapping for the initial year of monitoring the built-up area. During these 21 years, the newly developed areas were widely distributed around the city center of Karachi, mainly concentrated in the northwestern, northern, northeastern, and eastern areas. The reclamation of the Karachi Port was also one of the main components of the new built-up areas (Fig. 2). Since 2000, the area of urban built-up areas has been increasing annually, with the peak of interannual variation occurring from 2014 to 2017, mainly due to the construction activities in the northern part of the city and along the Karachi coast. The annual growth rate of urban built-up areas ranged from 0.1 to 8.7%, with an average annual growth rate of 4.7% (Table 1).Figure 2Interannual variation of urban expansion in Karachi. The map created in ESRI ArcMap 10.2 (https://support.esri.com/zh-cn/products/desktop/arcgis-desktop/arcmap/10-2-2).Table 1 Interannual variation area, growth rate, and proportion of urban built-up area in Karachi.From the interannual perspective of urban expansion, since 2000, cities have gradually expanded from the central areas to the outside, and the urban area has been expanding over time. From 2000 to 2005, urban expansion areas were located in and around the Karachi city center, mainly the undeveloped areas within the city center and the surrounding areas. From 2005 to 2010, the city gradually began to expand to further areas, and the construction activities of satellite cities also increased rapidly around the city. Since 2010, urban expansion has reached an unprecedented speed, with a large amount of idle land in the west, north, and east being developed and gradually expanding outward in spatial and temporal terms.Analysis of duration of urban built-up areasFigure 3 shows the duration of disturbance of newly developed areas in Karachi from 2000 to 2020, and maps the spatial distribution according to the duration gradient. In general, the duration of disturbance for newly built area objects was 1–9 years. Figure 4 shows the area and proportion of different durations, with the largest proportion being four years, accounting for 16.03% of the total area. Sixty percent of the total area remained undeveloped for less than 5 years. The spatial distribution of the disturbance duration in the urban built-up areas showed the following characteristics: the urban center and coastal areas had a shorter duration of 1–3 years, whereas the western and northeastern areas had a longer duration of 5–8 years. This indicates that the rate of urbanization in the coastal region was higher than that in the other regions.Figure 3Duration of disturbance of newly added objects in urban built-up areas of Karachi. The map created in ESRI ArcMap 10.2 (https://support.esri.com/zh-cn/products/desktop/arcgis-desktop/arcmap/10-2-2).Figure 4Area of the duration of disturbance of the urban built-up area object.Accuracy assessmentAccuracy assessment of annual change monitoringThe overall accuracy of the disturbance time of the objects in the urban built-up area was 83.76%, and the kappa coefficient was 0.79. User accuracy ranged from 77.14 to 100%, with an average value of 89%; the lowest value was T3 (2009–2011). The user accuracy was high at T1, T2, and T7. The producer accuracy ranged from 66.67% to 100%, with an average value of 83%, and the lowest value of 66.67% at T7 (2018–2020), while the highest value of 100% was at T1. The error matrix between the prediction year and the reference year can be found in Table S1 online, and the errors of the year are concentrated in the time interval before or after the reference year. The fitting results between the predicted year and reference year from the real sample points on the ground are shown in Fig. S1 online. The results show that the proposed framework can effectively extract the disturbance time of urban built-up areas.Owing to its special geographical location, Karachi has expanded rapidly to inland areas (northwest, north, northeast, and east) and coastal areas (south) over the past 20 years, this is consistent with the findings of previous studies28,29. As shown in Fig. 5, new construction sites in the northwest and north, and along the coast are dominated by new residential buildings (Fig. 5a), especially in the Malir and West districts, where the promotion and implementation of the Karachi housing scheme is evident30. In terms of the spatial distribution of expansion, we obtained results that are highly consistent with previous studies29. The newly added urban built-up areas in the northeast of Karachi have been mainly theme parks and housing projects since 2015, concentrated in the Bahria Town area, covering an area of approximately 35 km2 (Fig. 5b). In addition, the newly built areas in the southeast coastal area of Karachi are predominantly housing (Fig. 5c), mainly in the Defence Housing Authority region, with a newly added area of approximately 22 km2.Figure 5Map of the spatial distribution of new urban expansion areas in Karachi, 2000–2020. (a) Newly constructed residence estates in the north, (b) newly built theme park and residences in Bahria Town, Karachi, (c) newly built residential area to reclaim the sea. (The map created in ESRI ArcMap 10.2, https://support.esri.com/zh-cn/products/desktop/arcgis-desktop/arcmap/10-2-2). Image data source in the upper left: Landsat OLI image (2020) from USGS (United States Geological Survey). Time series images (2000, 2004, 2008, 2012, 2016, and 2020 were obtained from Google Earth Pro 7.3.4 (https://www.google.com/earth/versions/#earth-pro).The urban area of Karachi increased by 144.97% from 2000 to 2020. The fastest urban expansion occurred after 2010, accounting for 69.87% of the total area of urban expansion. The peak interannual variation occurred between 2014 and 2017. Population growth and migration are the driving factors of continuous urban expansion31. Karachi is the capital of the Sindh province, and its economic and geographical conditions are attractive to the surrounding population. According to the population census data, the population of Karachi was approximately 9.3 million in 199832. In the 2017 census, Karachi had a population of 16.05 million, an increase of 70.9% from 1998, of whom 14.9 million were urban population32. The trends of population growth and urban expansion in Karachi are shown in Fig. S2 online. This trend shows that urban areas increase with population size. The results of Baqa et al. (2020) also suggest that population growth in Karachi is one of the main drivers of urban expansion29. Karachi’s economic superiority over other Pakistani cities is also an important factor in urban expansion. In 2012, Karachi generated at least 11.4% of GDP, with GDP per capita nearly 44% higher than the national level. Such a prosperous econ
https://www.nature.com/articles/s41598-021-02565-9
Dynamic monitoring of urban built-up object expansion trajectories in Karachi, Pakistan with time series images and the LandTrendr algorithm