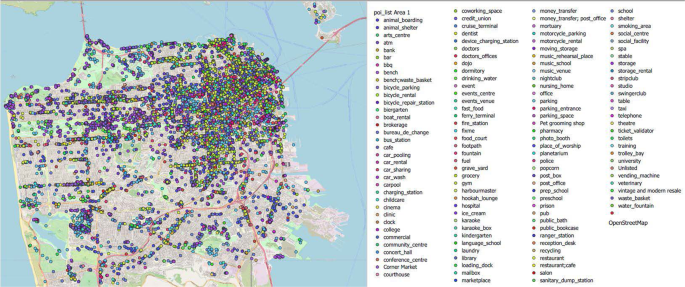
Crash and disengagement data of autonomous vehicles on public roads in California Autonomous Vehicles (AVs) are being widely tested on public roads in several countries such as the USA, Canada, France, Germany, and Australia. For the transparent deployment of AVs in California, the California Department of Motor Vehicles (CA DMV) commissioned AV manufacturers to draft and publish reports on disengagements and crashes. These reports must be processed before any statistical analysis, which is cumbersome and time-consuming. Our dataset presents the processed disengagement data from 2014 to 2019, crash data till the 10th of March 2020 and supplementary road network and land-use data extracted from OpenStreetMap. Primary data are manually assessed and converted into an easily processed format. Our processed data will be advantageous to the research community and enable accelerated research in this domain. For example, the data can be utilised to discern trends in disengagement, observe the distribution of disengagement causes, and investigate the contributory factors of the crashes. Such investigations can subsequently improve the reporting protocols and make policies and laws for the smooth deployment of this disruptive technology. Measurement(s) autonomous vehicles • disengagement • crashes • reaction times Technology Type(s) manual entry • OpenStreetMap • Google Maps Factor Type(s) temporal interval Sample Characteristic – Location State of California Machine-accessible metadata file describing the reported data: https://doi.org/10.6084/m9.figshare.15049227 Autonomous Vehicles (AVs) are being widely tested on public roads in several countries around the world. Although AVs are becoming more competent due to advancements in sensing and navigation technologies, safety stands as the biggest challenge in adopting this disruptive technology1. Currently, there are two major categories of ‘field’ datasets that are publicly available; the crash and disengagement reports by the California Department of Motor Vehicles (CA DMV) and the extensive sensor (lidar and camera) datasets like KITTI2, Waymo3, etc. The latter category of datasets is proficient for accelerating research in computer vision, localisation, and behaviour cloning but lacks information about the critical instances (crash and disengagements). On the other hand, CA DMV disengagement and crash reports are the foremost publicly available datasets containing information about the critical instances. These critical events data are beneficial for laying a roadmap for the deployment of AVs, which includes reporting protocols, legal frameworks, and infrastructure maintenance plans. Table 1 presents the different categories of datasets used by researchers to evaluate the safety and performance of AVs.Table 1 Different Categories of Datasets Available for Analysing AVs.For the transparent deployment of AVs in California, the CA DMV commissioned AV manufacturers to draft and publish reports on disengagements and crashes. As a result, several researchers used the CA DMV reports to evaluate AVs’ safety-critical events. Most of the earlier studies focussed on discerning the trends in disengagements and crashes involving AVs4,5,6,7,8,9. Recently, a few studies have used these reports for developing statistical models. For example, one such study developed a nested logit model using three distinct outcomes: (1) no disengagement, (2) disengagement with no crash, and (3) disengagement with a crash10. The study also estimated endogenous switching models and deduced that disengagements lessen over time, and factors related to AV systems and other roadway participants elevate the tendency of disengagement without a crash. In another study, driving mode (autonomous vs manual mode), collision location, roadside parking protocol, rear-end collision, and one-way road were found to be significantly influencing crash severity11.Another study developed fixed and random parameters binary logistic regression models to evaluate disengagement initiation12. The study emphasised that unfitting interpretations are possible if the random parameter approach is not used. Significant variables included location (highway or street), maturity of testing (months of testing), and cause (environmental, another road user, hardware or software discrepancy, and path planning discrepancy). The study also found that as the maturity of the testing increases by a month, the probability of automated disengagement increases by 0.014. Another study developed a Bayesian latent class model that identified six classes of collision patterns13. The authors pointed out the necessity of more advanced and robust collision narrative reporting for better analysis of the critical events. More recently, machine learning techniques were used to evaluate the crash severity of AVs14.As evident, more complex models are being developed lately based on the CA DMV reports. However, these reports must be processed before conducting any statistical analysis, which is cumbersome and time-consuming. Furthermore, new crashes and disengagements are happening with more test vehicles on the road, and new data are appended regularly to the CA DMV dataset. The exclusion of the latest data used in the previous studies can result in premature findings7 and require constant scrutiny. Additionally, the advancement of this technology may change the currently observed trends15. Since the crash data are considered over a prolonged period, the time-varying explanatory variables may vary significantly. Neglecting latent within period variation may result in the loss of crucial explanatory variables. This loss of information by using discrete-time intervals can institute error in model estimation because of unobserved heterogeneity16,17, and hence studies using this data are required to be updated in the light of new information available.In this context, we present the processed disengagement data from 2014 to 2019, crash data till the 10th of March 2020 and supplementary road network and land-use data of the AV testing locations in California. For the preparation of the current dataset, primary data in the form of crash and disengagement reports were requested from CA DMV. The primary data are extracted and organised into the processable format for potential reuse. Furthermore, OpenStreetMap and Google maps were used to extract supplementary data, which could be utilised to expand the research around AVs’ safety like in a previous study11, preparing guidelines and governance for AV deployment on public roads.Specifically, the research community, government organisations, and public forums active in AV-related safety studies can benefit from this processed dataset. A comprehensive reporting protocol is necessary for the well-ordered deployment of AVs on public roads in any area. Henceforth, research can be conducted using our dataset towards identifying the shortcomings and fallibility of the reporting protocols used by CA DMV and assist government organisations around the world to devise better protocol systems for transparent deployment of AVs on public roads. For example, a limitation of the current CA DMV reports was pointed out by a previous study4, which stated to include the categories of disengagements in the reporting protocol by analysing the categorisation of disengagements into proposed macro and micro categories. Macro-level and spatial models of AV crashes can also be estimated using the supplementary data provided by our spatial database. They can be utilised to assess the hotspot crash/disengagement locations. Furthermore, the rate of disengagements can be affected by expanding the testing area as new and unfamiliar roads can generate new challenges for the AV brain. It is recommended to include testing area details in the reports. Also, new studies are advised to take into account the effect of spatial features. Eventually, managing a database that can be directly used without further processing or organisation could help accelerate the research and promote consistent terminologies, which is the contribution of this dataset. The processed data can bring consistency in the studies since different authors might use different appellations and can be readily imported to modelling and analysis software, thereby facilitating reproducible research.Our processed dataset contains disengagement data from 2014 to 2019 and crash data until the 10th of March 2020. The disengagement primary data are reported by CA DMV at the end of every year, and the crash primary data are continuously updated. There are four kinds of data in our repository, viz. disengagement data, crash data, street network data and land use data. The procedure of their extraction is presented in the following sections.Disengagement and crash dataPrimary data, i.e. disengagement and crash reports, were requested from CA DMV18. The reports are in pdf files and scanned copies of handwritten text. Authors manually scrutinised each report and converted them into excel and comma-separated files that can be processed by statistical tools like Stata, Nlogit and can be imported directly using scripting languages like Python or R for further analysis. A consistent data entry convention was discussed and developed considering different tools and scripting languages. The process of converting the reports into a processable format was time-consuming and cumbersome. More than three months was invested in going through reports and processing them. Automation of extraction of data from reports was infeasible since some manufacturers are submitting handwritten reports.Additionally, some reports have subjective responses and hence required manual data entry and an expert’s elucidation. As a result, the data preparation required extensive manual hours investment. Furthermore, an extensive discussion was required to deduce the features that are not explicitly reported but can affect the crash, such as location characteristics (intersection, parking protocol and traffic light) and vehicle type. The latitude and longitude of every crash location were extracted from Google maps, and the ‘street view’ feature of Google maps was used to discern location characteristics. The car model of the non-AVs involved in the crash mentioned in the reports was used to discern the ‘vehicle type’ and resources like Wikipedia and manufacturers’ websites were used. Some of the key descriptive statistics of the crash data are presented in Table 2. Through the availability of this processed data, research groups worldwide could bypass these cumbersome steps and accelerate their research.Table 2 Variable Definitions and Summary Statistics of Crashes from Our Dataset22.Street network and land use dataPython was used in the extraction of both street network and land use data. GeoPandas19, OSMnx20, and Pandas21 modules were used to assist with data manipulation. The geographical coordinates specified by the user (geocoded from crash data) are used to extract the road network (edges and nodes) using the OSMnx module. Custom filters are used as additional arguments to limit the results of the process (i.e., only returning edges and nodes, and not additional map features like pedestrian paths and building structures). Any missing features (due to incomplete data from OpenStreetMap) are assigned default values as appropriate (such as speed limits). Edges with multiple classifications are assigned only the highest classification (e.g., if an edge is both ‘primary’ and ‘residential’, assigned only ‘primary’ attribute). Any non-one-way roads are adjusted so that there are two edges for each of those roads (one for each travel direction). The street network data is in the form of shapefiles which can be opened using any geographic information system (GIS) tool such as QGIS or ArcGIS. Finally, the land-use data, in the form of points of interest (POI) such as restaurants, clinics, banks, etc. are also extracted from OpenStreetMap using OSMnx, by specifying the same coordinates as were used for network extraction. Extraction of spatial information took additional 20 hours.This section discusses the organisation of the processed data in the figshare repository22. Table 3 outlines the structure of the repository. There are four folders in the repository.Table 3 Data Repository Structure.DMV Crash Report (Secondary Data)The folder includes a Microsoft Excel file ‘DMV Crash Data.xlsx’, which contains three sheets. The Crash datasheet contains the processed information from the original reports of CA DMV (primary data) and is manually inputted into this excel file. README sheet contains the variable definitions, and the Variable sheet contains the summary of the data.DMV Disengagement Report (Secondary Data)The DMV Disengagement Report folder contains seven Microsoft Excel files, and their description is provided below. ○2014_DISENGAGEMENT, 2015_DISENGAGEMENT, 2016_DISENGAGEMENT, 2017_DISENGAGEMENT, 2018_DISENGAGEMENT and, 2019_DISENGAGEMENT These excel files contain the yearly disengagement data extracted from the CA DMV reports (primary data) in the years 2014–2019. In each of these files, there are several tabs, of which the first one is a ‘README’ tab that provides a brief description of the corresponding excel file and the data layout. The second tab in these files provides the summary of disengagement data within each year, including the miles driven and the number of manual and automatic disengagements by each company in each month of that year. The rest of the tabs in the Excel files provide individual disengagement records (not always reported by all companies), including the reason for disengagement and in some cases, the reaction time to take over after disengagement. For example, the 2016_DISENGAGEMENT file has six other tabs where the manufacturers have recorded individual disengagements. Similarly, 2017_DISENGAGEMENT and 2019_DISENGAGEMENT files have eight and thirty-five additional tabs, respectively, that have information for individual manufacturers. The 2018_DISENGAGEMENT file has 35 additional tabs containing information of individual manufacturers (Apple has three subfiles, and UATC (Uber) has 2, due to their large dataset). ○COMBINED_DISENGAGEMENT_SUMMARY This excel file is a combined summary of all the aforementioned excel files, where the file displays the monthly miles driven, number of automatic and manual disengagements reported by each company from 2014 to 2019.Land Use (Supplementary Data)This folder contains two comma-separated value (CSV) files; poi_List Area 1(San Francisco) and poi_List Area2 (San Jose), consisting of the information about the points of interest of these two areas, including the spatial coordinates. Figure 1 shows the map of Area 1 along with a legend for all the extracted POIs. Figure 2 represents a sub-area within Fig. 1 for better distinguishment of the different POIs.Fig. 1Land Use Data (Points of Interest). ‘Land use’ is the term used to describe the human use of land. It represents the economic and cultural activities (e.g., agricultural, residential, industrial, mining, and recreational uses) that are practiced at a given place24. The land-use data, in the form of points of interest (POI) is presented in this figure. This figure is an illustration of land use data for area 1 (San Francisco). Each point in the figure represents the land use characteristics. The description of the coloured pointslegends is presented in the list next to the figure.Fig. 2Land Use Data for a Sub-Area within Area 1. This figure represents the land use characteristics of a sub-area within Area 1. The different POIs can be better distinguished with the help of this figure.Street Network Data (Supplementary Data)This folder contains two sub-folders: Area1(San Francisco
https://www.nature.com/articles/s41597-021-01083-7
Crash and disengagement data of autonomous vehicles on public roads in California