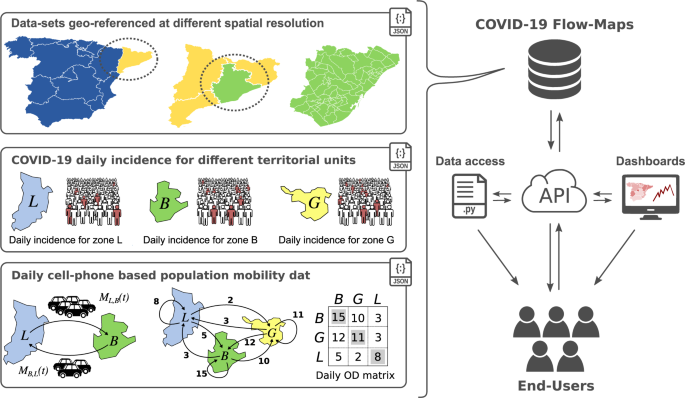
COVID-19 Flow-Maps an open geographic information system on COVID-19 and human mobility for Spain Data Descriptor Open Access Published: 30 November 2021 Scientific Data 8, Article number: 310 (2021) Cite this article Data integrationInterdisciplinary studies COVID-19 is an infectious disease caused by the SARS-CoV-2 virus, which has spread all over the world leading to a global pandemic. The fast progression of COVID-19 has been mainly related to the high contagion rate of the virus and the worldwide mobility of humans. In the absence of pharmacological therapies, governments from different countries have introduced several non-pharmaceutical interventions to reduce human mobility and social contact. Several studies based on Anonymized Mobile Phone Data have been published analysing the relationship between human mobility and the spread of coronavirus. However, to our knowledge, none of these data-sets integrates cross-referenced geo-localised data on human mobility and COVID-19 cases into one all-inclusive open resource. Herein we present COVID-19 Flow-Maps, a cross-referenced Geographic Information System that integrates regularly updated time-series accounting for population mobility and daily reports of COVID-19 cases in Spain at different scales of time spatial resolution. This integrated and up-to-date data-set can be used to analyse the human dynamics to guide and support the design of more effective non-pharmaceutical interventions. Measurement(s) COVID-19 cases • mobility • population Technology Type(s) Real Time PCR • mobile phone Sample Characteristic – Organism Homo sapiens • Severe acute respiratory syndrome-related coronavirus Sample Characteristic – Location Kingdom of Spain Machine-accessible metadata file describing the reported data: https://doi.org/10.6084/m9.figshare.15198123 COVID-19 is an infectious disease caused by SARS-CoV-2 virus, which has spread all over the world, leading to a global pandemic state. The fast progression of COVID-19 has been mainly related to two crucial factors, the high contagion rate of the virus, as well as, the worldwide mobility of humans. The high contagious rate has represented one of the leading causes of healthcare systems collapse in several countries, such as Italy and Spain, contributing to a large number of deaths. As a result, and in the absence of vaccines or other pharmacological therapies, governments from different countries have introduced several non-pharmaceutical interventions (NPI) to reduce human mobility and social contact1. Different NPIs include, but are not limited to, the closing of national borders, the temporal partial or total lockdowns, and social distancing measures with the aim of attenuating the epidemic2.Several studies based on Anonymized Mobile (cell) Phone Data (AMPD) have been published analysing the relationship between human mobility and the spread of coronavirus3. For instance, in a study conducted in the USA, the authors reported a high correlation between human mobility and COVID-19 transmission rate4. A similar study conducted in Italy reports that mobility restrictions and social distancing policies could reduce contagions up to 45%5. AMPD has also been used to study how the different NPIs can change the underlying structure of the human mobility networks and how those changes affect the spread of the disease6,7.AMPD has also been integrated into epidemiological models to simulate the spread of SARS-CoV-2 in time and space. For instance, a model integrating human mobility was used to predict the first wave of COVID-19 cases in Spain and to call the government to enforce a full lockdown8,9. Similarly, models have also been used to study the impact of mobility restrictions, physical distancing, as well as the impact of lockdown on social inequalities10,11,12. Models are critical in the design of NPIs to effectively mitigate the pandemic while reducing the negative impact on the economy, education, and other social activities13,14. However, developing realistic models to guide policy-makers decisions requires high quality and up-to-date data15. Ideally, data records should be open access, de-identified, periodically updated, and should include data on human mobility, COVID-19 daily cases, and contact tracing, among other sources of information. Furthermore, data records should be properly geo-localized with the highest possible degree of spatio-temporal resolution16.Several data-sets on human mobility have been made publicly available to help analyse and model the epidemic dynamics. Pepe et al., have released a data-set based on 170,000 de-identified and aggregated smartphone users that account for movements between Italian provinces17. Another notable data-set includes a regularly updated multi-scale human mobility dynamic network across the United States18. Furthermore, data-sets on COVID-19 cases across the globe have been also released19,20. However, to our knowledge, none of the cited data-sets integrates cross-referenced geo-localized data on human mobility and COVID-19 cases into one all-inclusive open resource.Herein we present a cross-referenced geographic information system (GIS) named COVID-19 Flow-Maps to manage, retrieve, visualise and analyse regularly updated time-series data on population mobility networks and daily reports of COVID-19 cases in Spain (Fig. 1). Human mobility data is provided as Origin-Destination (OD) matrices at different levels of spatial and temporal resolution (district, province, and autonomous community on a daily and hourly basis). Every mobility data record reports the number of people performing zero, one, two, or more trips, on a daily basis. Health data consisting of daily confirmed COVID-19 cases is also provided on a daily basis and at different levels of spatial resolution. All the data has been gathered from official access points, as detailed in the sec:data-rec section. We offer provenance records that track the origin of the data and information regarding all the processing steps in those cases where the data has been consolidated. All data records are regularly-updated and are accessible through an Application Programming Interface (API) as well as through a dedicated GitHub repository. We also provide an interactive web application for exploring the data. In this work, we present the system and illustrative examples to show how the combination of mobility and health data can help public health directives to effectively mitigate COVID-19 transmission.Fig. 1Graphical representation of COVID-19 Flow-Maps Geographic Information Systems. The main data records include geographical layers for different territorial units, COVID-19 daily cases reported at different spatial resolution and phone-based anonymized mobility data in the form of daily origin-destination matrices. All the information is stored in a non-SQL database that can be directly queried through a REST-API, downloaded using provided scripts, and accessed through web-based interactive data dashboards.The COVID-19 data records for Spain are retrieved from endpoints provided by a variety of official sources including national-level reports, as well as those reported by autonomous community governments (see COVID-19 data and Data Records section and Online-only Table 1). As data is obtained from different sources, each record differs in its format, including different fields, field names, and different levels of aggregation (e.g. age, gender). Additionally, data retrieved from different sources are mapped into different geographical layers (e.g. autonomous communities, provinces, municipalities). Therefore, in addition to the COVID-19 reported cases, the spatial information needed for its mapping is also retrieved from the corresponding official sources (see Online-only Table 2). Population mobility records based on AMPD are reported by the Spanish Ministry of Transport, Mobility and Urban Agenda (MITMA, Ministerio de Transportes, Movilidad y Agenda Urbana) in tabular format and it includes two different daily reports, as well as the geographical layer needed to map the data (for further details see Mobility data in Data Records section).Data processing and consolidationTo automatically update the COVID-19 Flow-Maps data records we have implemented a workflow that retrieves data from different endpoints, processes and stores new records (see Code availability section). The first step in this workflow is to validate new entries by checking inconsistent and missing values. Secondly, the system controls for duplicated entries ensuring that for any given territorial unit on a given date a single reported value exists. Finally, for all the integrated data sources, the original entries, as well as the registry of any modification, are also stored in the provenance collection (see Data Provenance subsections). For each geographical layer needed to geo-localise each data entry we stored all the geometries, translating the Geographic Coordinates on ETRS89 Datum (EPSG:4258), and assigning them a symbolic and unique layer name (see Geographical Layers in Data Records section).COVID-19 cases reportsWhen integrating a source that reports COVID-19 cases, three key attributes are first identified, namely, the date for the reported event, the reported value (e.g. daily/accumulated incidence) and any attribute that can be used to geo-reference the data. Geo-referencing attributes can be geographic coordinates or, more usually, an identifier that matches a geometry of a defined geographical layer, e.g. the unique identifier of a municipality and a reference to that layer. For instance, the government of some autonomous communities reports COVID-19 cases on a daily basis at the level of Basic Health Areas (BHA) whereas others report cases by municipalities (see COVID-19 data and Data Records section). Missing values of the daily incidence for a given date or geographic area are imputed with zero values, while missing values of cumulative incidence are imputed based on the previous available value. After validation, since some data sources either report daily incidence or cumulative incidence, we also calculate one attribute from the other. Moreover, field names are normalised while also keeping the original field names and values to be queried. Additionally, commonly used metrics such as accumulated incidences over one and two weeks are also calculated and stored.Reconstruction of mobility networksThe reconstruction of mobility networks relies on two main sources of information, namely: recorded events data and mobile phone network topology data. The former corresponds to anonymized data associated with the connection records of the mobile devices with the mobile phone network. These records include both active and passive events. Active events are made up of CDRs (Call Detail Records) that provide a record every time a device interacts with the network (calls, sending text messages, data sessions). These records are joined with passive events data (periodic update of the device position, changes in coverage areas, etc.), providing a very high temporal granularity. Regarding spatial resolution, location information is available at the level of the coverage area of each antenna – which implies a spatial resolution of tens or hundreds of meters in the city and up to several kilometres in rural areas, which provides an idea of the uncertainty that is introduced in the determination of the position according to the areas analysed.The recorded events data are processed in a secure environment within the mobile operator’s infrastructure where this data is aggregated and anonymized in compliance with the existing European and Spanish legislation, e.g. LOPD-ODD (Ley de Protección de Datos). The phone network data includes the location of the communication towers which are used to obtain a Voronoi Diagram of the cellular coverage map. Additional sources used include land use information from the Spanish Land Use Information System (SIOSE), population data (i.e. the register of inhabitants by districts) and the Spanish transportation network (e.g. airports location, rail network, etc.).The first step in the data processing workflow consists of the extraction and pseudonymization of the mobile (cell) phone records. The pseudonymization of the records is based on the use of a one-way hash function, that is, a function that allows the calculation of an anonymized identifier from the original identifier (usually the International Mobile Subscriber Identity) in such a way that it is impossible to carry out the reverse process. Furthermore, a perfect hash function is used to avoid collisions, i.e. that two different original identifiers produce the same anonymized identifier. The anonymized phone records are stored in a secure environment within the infrastructure of the mobile operator, where the algorithm used to aggregate the anonymized data will also run.The processing and analysis of the raw data can be divided into the following steps21: (i) pre-processing and cleaning of the data; (ii) construction of the sample; (iii) identification of the place of habitual residence and the place of overnight stay; (iv) extraction and inferences of activities and trips; (v) extrapolation of sample results; and (vi) generation of indicators. First of all, a pre-processing of the mobile phone data is carried out to facilitate its management, ordering and grouping the records in the most convenient way for further analysis. A data integrity check is also carried out to eliminate possible errors in the mobile operator’s data. The process of data cleaning and debugging of errors is essential to ensure the quality of the data, preventing possible source of errors from distorting the results obtained with the algorithms used for the extraction o
https://www.nature.com/articles/s41597-021-01093-5
COVID-19 Flow-Maps an open geographic information system on COVID-19 and human mobility for Spain