Effects of knowledge and information provision about carbon taxes
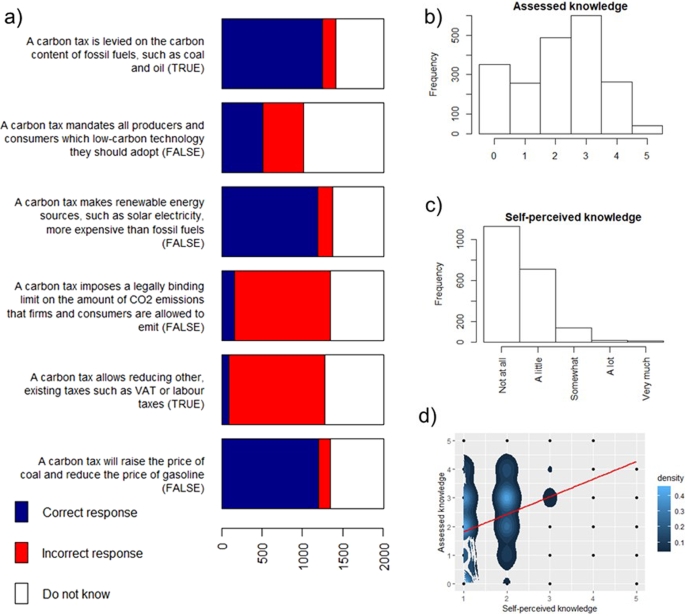
First, we examine how assessed and self-perceived knowledge about a carbon tax affects acceptability and perceptions. To determine assessed knowledge, we asked respondents to answer six questions as ‘true’, ‘false’ or ‘don’t know’ (Fig. 1a). Their responses were aggregated using a Mokken scale30. In particular, we count only correct responses as an indication of knowledge and exclude the fifth item due to its weak scalability (see ‘Methods’ section). The resulting indicator is shown in Fig. 1b. We measure self-perceived knowledge by asking respondents to assess their knowledge about a carbon tax on a scale between 1 and 5 (Fig. 1c). Most people perceive themselves to have little or no knowledge at all.
Fig. 1: Construction of, and relation between, assessed and self-perceived knowledge. a Items used to assess knowledge about a carbon tax and their response distribution (correct answers in capital letters in brackets); b distribution of assessed knowledge; c distribution of self-perceived knowledge; d rank correlation with a 2D-density plot of self-perceived versus assessed knowledge, illustrating where most observations are concentrated. The rank correlation between assessed and self-perceived knowledge is 0.33 and significant at 1% level. The red line in the right plot indicates a fitted linear model. Full size image
The distribution of assessed and self-perceived knowledge among people with different levels of acceptability of a carbon tax, for unspecified revenue use, is demonstrated in Fig. 2. It reveals that people’s assessed knowledge is higher than self-perceived knowledge, particularly among people with a high acceptability of carbon taxation. This may be because respondents underestimate their knowledge about carbon taxes. This interpretation is consistent with other research on knowledge about climate change31. Our results further show that people with a low acceptability perceive themselves as having much knowledge about carbon taxation, i.e. when we compare them with the rest of the sample. Even so, the measure of assessed knowledge does not support this perception. This is confirmed by a formal test assessing the knowledge gap for each respondent, i.e. the difference between self-perceived and assessed knowledge (after z-scoring both measures to make them comparable), as shown in the right plot in Fig. 2, and regressing this on the acceptability of a carbon tax, giving a significant negative relationship (β = −0.0385, p value = 0.0479). This result is in line with the findings of a prior study that for controversial topics such as genetically modified food, and to a lesser extent climate change, extreme opponents have limited understanding of the matter but nevertheless think they know the most32. Our results further show that respondents who consider a carbon tax as ‘neither unacceptable nor acceptable’ (acceptability score 3) have on average the lowest assessed knowledge and self-perceived knowledge, though in the latter case the difference with other groups is not very large. It may mean that respondents with the least knowledge about the policy are the least interested in the topic and therefore do not have an opinion about it.
Fig. 2: Assessed and self-perceived knowledge for different levels of carbon-tax acceptability. Data are presented as mean values with error bars representing +/−2 s.e. Acceptability is measured on a 5-point scale ranging from 1 = completely unacceptable to 5 = completely acceptable. The red line in the right plot indicates a fitted linear model. Subgroups sizes are: N = 382 for acceptability level 1, N = 374 for acceptability level 2, N = 387 for acceptability level 3, N = 589 for acceptability level 4, and N = 272 for acceptability level 5. Full size image
Next, we compare assessed knowledge and tax acceptability between two subsamples of respondents: those who did and did not receive information about how the carbon tax works. The results are shown in Fig. 3. The information explained that the carbon tax is a charge on fossil fuels in proportion to the amount of carbon they contain as this determines how many CO 2 emissions result from their combustion, as well as consequences in terms of relative fuel and goods/service prices, and subsequent behavioural responses by producers and consumers. Our results show that people receiving information about the functioning of a carbon tax tend to have a higher probability to accept it, particularly those with already relatively high assessed knowledge, i.e. with levels 3 and 4. The difference between the subsamples is significant at 5 and 10% levels, respectively, according to a Kruskal–Wallis rank-sum test (p values at the bottom of Fig. 3). Providing information did not matter for respondents with absolutely no knowledge about carbon taxes (level 1), which might be due to an incapacity or unwillingness to process external information about the carbon tax. For very high assessed knowledge (level 5) the number of observations is too low to assess any significant difference. Supplementary Table 3 further supports these insights by offering results of an ordered logit regression conducted on the whole sample to examine the interaction between assessed knowledge and information provision for unspecified revenue use.
Fig. 3: Relationship between assessed knowledge and acceptability of a carbon tax with and without information provision, for unspecified revenue use. Results include averages and error bars depicting +/−2 s.e. Acceptability is measured on a 5-point scale: 1 = completely unacceptable to 5 = completely acceptable. At the bottom are p-values of a Kruskal–Wallis rank-sum test with Bonferroni correction for statistical differences between the two subsamples. Subgroup sizes are: N = 353 for assessed knowledge equalling 0, N = 256 for assessed knowledge equalling 1, N = 488 for assessed knowledge equalling 2, N = 600 for assessed knowledge equalling 3, N = 264 for assessed knowledge equalling 4, and N = 43 for assessed knowledge equalling 5. Full size image
Impact of revenue use on perceptions and acceptability
Next, we test which revenue use(s) (including unspecified use) of a carbon tax maximize its acceptability, how they affect perceptions, and how these relationships depend on whether respondents received information or not. Fig. 4 shows the different outcomes for groups with and without the information-provision treatment. To test statistical differences, we undertook a pairwise Mann–Whitney test for different revenue uses and a Kruskal–Wallis rank-sum test for experiment vs control groups (Supplementary Fig. 1). Three main findings are as follows. First, a carbon tax with all revenues spent on support of climate projects is the most accepted option (average acceptance rate 3.88, while other revenue uses stay below 3.5). The two revenue uses that mix climate projects with transfers to either low-income or all households show a higher acceptability than unspecified revenue use and the other two single revenue uses.
Fig. 4: Effect of providing information on acceptability and perceptions under distinct revenue uses. Dots indicate the average results with error bars indicating +/−2 s.e. All survey questions were using a 5-point scale (e.g. acceptability: 1 = completely unacceptable to 5 = completely acceptable). N = 2004 (1000 with no information provided and 1004 with information provided) for each revenue use option and for acceptability and each of the four perceptions. Full size image
Second, using the revenues for supporting climate projects increases perceived effectiveness and fairness compared to both unspecified and other specified uses. The latter result is somewhat surprising given that revenue use for supporting climate projects was perceived by the respondents as relatively unfavourable for poor households. Climate projects were nevertheless considered by respondents to make them better off personally (‘personal effects’) compared to the other revenue options. The second option perceived as both more effective and fair is distributing the revenues to low-income households and climate projects. Using the revenues for low-income transfers rather than for supporting climate projects was perceived to make poor people better off. Respondents considered returning revenues to poor or all households as the least effective in terms of emissions reduction compared to the other revenue uses.
Third, we find that information provision tends to result in more favourable acceptability, perceived fairness and effectiveness of a carbon tax for unspecified revenue use and to a lesser extent for revenues going in equal amount to all households, while it shows no significant effect for the other revenue schemes.
We also asked respondents how they would allocate tax revenues to different uses if they had complete freedom to decide about this. The results are summarized in Fig. 5. The left chart shows results for all respondents (N = 2004), while the right and central chart present results for respondents who initially accepted a carbon tax (n = 861) and those who did not before any revenue use was specified (n = 756). We find that more than half of the sample prefers a combination of the three revenue uses: support climate projects, transfers to low-income households and transfers to all households. These respondents generally prefer to allocate a greater share of revenues to support climate projects than to the other two uses, particularly among those respondents accepting a carbon tax (i.e. 45% on average, 41% for those not accepting a carbon tax, and 50% for those accepting). Similarly, a higher preference for spending money on climate projects is found among people accepting the policy but preferring single or mixes of two revenue uses. This generalises previous findings in the literature for single revenue uses to mixed revenue uses11. On the other hand, opponents of a carbon tax tend to favour transfers to all or low-income households.
Fig. 5: Preferred allocation of revenues from a carbon tax. Respondents were asked to express the share (in %) of total revenues to be allocated to each revenue use. The left chart is for all respondents, while the right and central charts are for respondents who initially accepted or did not accept a carbon tax before any revenue use was specified. The coloured parts of each bar indicate average shares. Respondents with high (low) acceptability are defined as having a response of higher (lower) than 3 (on a scale from 1 to 5). Respondents who chose the median (3) option were excluded from the centre and right plots of the figure. Full size image
We repeated the analysis for indifferent respondents only (i.e. 387 persons who chose the median (3) option when asked about their acceptability of a carbon tax) and find that the distribution of revenues for this group is very similar to that of the total population (Supplementary Fig. 2). We further analysed whether the allocation of revenues for climate projects varied with the acceptability of the policy among respondents who endorsed all three revenue options. Our results show that those who rejected a carbon tax allocated on average 40.74% to climate projects, those indifferent 41.42% and those who supported the tax 49.79%. Applying a Kruskal–Wallis rank-sum test to compare the allocation of revenues to climate projects between these three groups, we find a chi-squared = 58.08 with df = 2 and p-value = 0. This means that the allocation of revenues significantly differs between the three groups. More specifically, while choices by those who reject and by those who are indifferent about a carbon tax are not significantly different (p-value = 0.82), choices by carbon-tax supporters are significantly different from both those who reject (p-value<0.0001) and those who are indifferent (p-value<0.0001). Our results thus provide evidence that, despite respondents' fairly low knowledge about carbon taxes (Fig. 1), they do not endorse all possible options equally, as may be expected by the ‘ignorance prior' effect (Supplementary Figs. 3 and 4). This effect suggests that respondents prefer all options almost equally due to being ignorant about the topic they are assessing33.
Next, to examine how carbon tax acceptability and perceptions relate to revenue uses, knowledge and information provision, we ran several ordered logit regression models. These treat perceptions of survey respondents under each of the six revenue uses as separate observations (including the unspecified option). Results are shown in Table 1. Apart from the five specified revenue uses (the unspecified use serves as a benchmark), the models include self-perceived knowledge, interaction terms between assessed knowledge and the revenue uses (to see if people with higher prior knowledge about the policy tend to prefer any of the revenue uses), and between information and revenue uses (to test if the information provision is improving policy perception under distinct revenue uses). In addition, we account for socio-demographic and other control variables collected in our survey, such as age, gender, education, trust in politicians, climate change concern and political orientation.
Table 1 Determinants of acceptability and perceptions. Full size table
Table 1 shows that, in line with Fig. 4, all specified revenue uses significantly increase acceptability compared to unspecified revenue use, with climate projects being the revenue use that increases acceptability and perceived effectiveness and fairness the most.
Information provision is found to affect policy acceptability and perceptions. The results in Table 1 indicate that people receiving information are more likely to accept a carbon tax with unspecified revenue use. In this case, information provision has a positive effect on perceived fairness and effectiveness. This effect is only weakly significant for revenues distributed to all households. For other revenue uses we also observe positive effects, but they are not statistically significant.
One interpretation of the foregoing results is that the information provided makes people aware that a carbon tax, regardless of its revenue use, is effective and fair, raising policy acceptability. Th
https://www.nature.com/articles/s41467-021-27380-8