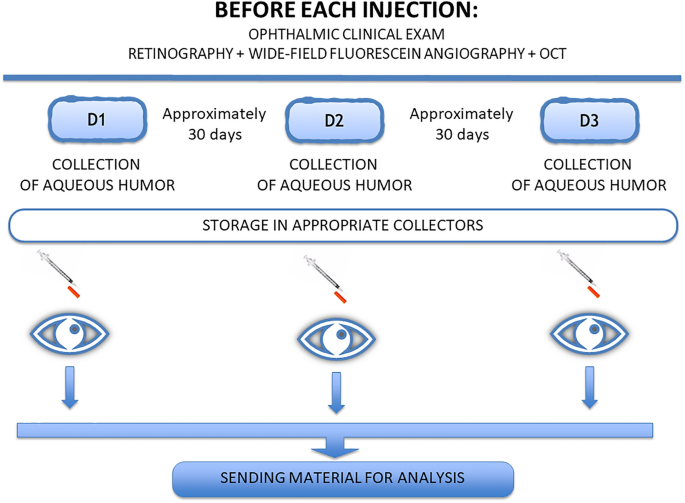
Analysis of cytokines in the aqueous humor during intravitreal Ranibizumab treatment of diabetic macular edema Scientific Reports 11, Article number: 23981 (2021) Cite this article AnthropologyBiochemistryBiological techniquesEye manifestations This study aimed to analyze the concentrations of VEGF, b-FGF, TNF, interleukin (IL)-1, IL-6, IL-8, IL-10, and IL-12 in the aqueous humor of patients with diabetic macular edema with and without peripheral retinal ischemia and to ascertain the changes in the levels of these molecules during treatment with ranibizumab. A therapeutic, prospective, randomized interventional study was carried out. Twenty-four eyes from 24 patients were studied and divided into 3 groups. Group 1 (9 eyes) included patients with diabetic macular edema without peripheral ischemia. Group 2 (10 eyes) included patients with diabetic macular edema with peripheral ischemia. Group 3 (5 eyes), the control group, included patients without systemic and/or eye diseases. Patients in Groups 1 and 2 received 3 intravitreal injections of 2 mg/0.05 ml ranibizumab at an interval of approximately 30 days. Before administering the injections, the aqueous humor was collected. In the control group, aqueous humor was collected before facetectomy. During treatment, the median IL-6 concentration significantly increased in Group 1 but showed a slight but not significant decrease in Group 2. Interleukin 8 levels were significantly different at the end of treatment compared to the beginning in Groups 1 and 2. TNF, IL-1, IL-10, and IL-12 levels were practically unchanged in both groups. VEGF was significantly reduced at the end of the study in Groups 1 and 2. B-FGF was not detected in most of the studied patients, and in those with detectable levels, there was no significant variation. There was a significant increase in the median level of interleukin 6 in the group without ischemia and a significant decrease in VEGF in both groups. The cytokines TNF, IL-1, IL-10, and IL-12 did not show significant variation. Diabetic retinopathy (DR) is one of the main causes of vision loss worldwide1.Macular edema (ME) is considered the main cause of visual impairment in patients with diabetic retinopathy and can appear at all stages of the disease, affecting approximately 30% of diabetic patients who have lived with the disease for more than 20 years2,3,4,5.Tests such as optical coherence tomography (OCT) and fluorescein angiography (FA) are performed for the diagnosis and monitoring of patients with DR6.Fluorescein angiography is essential for acquiring information about the disease stage7,8. New devices called wide-angle fluorescein angiography can capture images with angles between 55° and 200°9. This new technology has aroused interest in analyzing the retinal periphery and correlating observed changes with the emergence and progression of diabetic retinopathy9,10,11,12.We believe that regions of poor perfusion stimulate the production of vascular endothelial growth factor (VEGF) and that high VEGF levels in the vitreous induce ME5,13,14,15.VEGF is increased in patients with diabetic retinopathy. Cytokines such as interleukins, TNF, and b-FGF are also altered in this disease16,17,18,19,20,21,22.We performed an unprecedented study in which we recruited patients with diabetic macular edema with and without peripheral retinal ischemia for an analysis and comparison of the concentrations of the molecules IL-1, IL-6, IL-8, IL-10, IL-12, TNF, VFGF, and b-FGF during intravitreal treatment with ranibizumab.All methods were performed according to relevant guidelines.The consent form was signed by all research participants or legal guardians.The samples were collected between April 2018 and March 2019.We performed optical coherence tomography with the Heidelberg Spectralis® HRA + OCT platform to diagnose edema and angiography with a noncontact lens using the Ultra-Widefield Spectralis® module at a 102° angle to detect the presence of peripheral retinal ischemia. Individuals who presented areas of ischemia with more or less than a 5-disc diameter area were included in the ischemia group.The study was approved by the Ethics Committee of the Medical Research Ethics Council of Hospital Agamenon Magalhães, Recife, Pernambuco.In the present study, patients were recruited from the Unified Health System. These patients usually do not have a real understanding of the disease or recognize that treatment must be continuous to be effective, even after receiving all our instructions.These circumstances and other facts have a considerable negative impact on patient recruitment and adherence to the study protocol. Therefore, the resulting relatively small sample renders it unfeasible to conduct a multivariate analysis with robust results.Study population and designThis was a therapeutic, prospective, randomized interventional study. The sample consisted of 24 eyes of 24 patients divided into 3 groups: Group 1 (9 eyes), DME without peripheral retinal ischemia; Group 2 (10 eyes), DME with peripheral retinal ischemia; and Group 3 (5 eyes), control (no systemic or eye diseases).Patients in Groups 1 and 2 received 3 intravitreal injections of ranibizumab at an interval of approximately 30 days. Before each treatment injection, we collected aqueous humor samples (Fig. 1). For Group 3, samples were collected on the day of cataract surgery.Figure 1Analysis of cytokinesThe Human Inflammatory Cytokine kit (BD) kit was used to analyze interleukins 1, 6, 8, 10, and 12 and TNF, and the CBA Flex Set (BD Medical) was used to evaluate human VEGF and bFGF.Evaluation of results and statistical analysisIn this study, data were previously evaluated to determine the need for parametric or nonparametric approaches. Thus, the variables included in the study were tested for distribution of normality and homogeneity using the Shapiro–Wilk and Bartlett tests, respectively.A significance level of 5% was applied. We used R software (R DEVELOPMENT CORE TEAM, 2016) to evaluate the results of the study.Inclusion criteriaThe inclusion criteria were as follows: diabetic macular edema diagnosed by wide-angle fluorescein angiography exams and optical coherence tomography; age at least 18 years; and no previous treatment with laser photocoagulation and no treatment with antiangiogenic drugs in the past 3 months.Exclusion criteriaThe exclusion criteria were as follows: cataract patients with corneal or vitreous opacities that prevent adequate visualization of the retina; patients with macular edema not due to diabetic retinopathy; patients who underwent previous vitreoretinal surgery in the eye to be studied; and refusal to participate in the study.Clinical and complementary examinationsPatients underwent ophthalmic clinical evaluations. Visual acuity exams were performed with better correction by ETDRS, applanation tonometry, biomicroscopy, and indirect binocular ophthalmoscopy.Optical coherence tomography and fluorescein angiography examinations were performed using the Heidelberg Spectralis® HRA + OCT platform. A noncontact lens was used in the Ultra-Widefield Spectralis® module to capture the 102° wide-field angiographic image.Collection and analysis of aqueous humorLimbal paracentesis was performed with a 30-gauge needle attached to a 1-ml syringe. The collected sample volume ranged between 0.10 ml and 0.3 ml.We quantified cytokine levels using the Cytometric Bead Array (CBA) system following the manufacturer’s instructions (BD Biosciences, USA). The cytokines IL-1, IL-6, IL-8, IL-10, IL-12, and TNF were analyzed using the Human Inflammatory Cytokine kit (BD), and human VEGF and b-FGF were analyzed using the CBA Flex Set from BD.Ethical approvalThis study was approved by the Ethics Committee of the Medical Research Ethics Council of Hospital Agamenon Magalhães, Recife, Pernambuco (Number: 2.540.686).Informed consentInformed consent was obtained from all individual participants included in the study.The number of participants in each group was small, which somewhat limited the results obtained.Studies with a larger number of patients should be conducted to obtain better data with greater fidelity.Group 1Group 1 included 9 patients (4 males and 5 females) aged 52–77 years (± 9.34) with diabetic macular edema without peripheral retinal ischemia; these patients were treated monthly with ranibizumab.Visual acuity and macular thicknessAt the end of the study, 8 patients showed an improvement in visual acuity, and one patient showed no visual improvement but maintained his or her initial vision (Fig. 2).Figure 2Comparison of the variation in visual acuity in the nonischemic and ischemic groups.Upon OCT examination, all patients presented a reduction in central macular thickness upon analysis of the macular thickness map, as illustrated in two patients (Fig. 3).Figure 3OCT showing a reduction in macular edema after treatment in Group 1.Clinical examinations and fluorescein angiographyUpon biomicroscopy examination, one patient was diagnosed with pseudophakia, and 8 were phakic. No cataracts formed on any lens during the study.At gonioscopy, neovessels at the angle or iris were not observed before or at the end of the study.Upon examination by angiography, no patient presented vascular changes in terms of staining type or retinal neovascularization during the treatment period.Group 2Group 2 included 10 patients (7 males and 3 females) aged 47–68 years (± 7.06) with DME with peripheral retinal ischemia; these patients were treated monthly with ranibizumab.Visual acuity and macular thicknessAt the end of the study, 8 patients showed an improvement in visual acuity. Those who did not improve maintained their initial visual acuity (Fig. 2).Upon OCT examination, all patients presented a reduction in central macular thickness upon analysis of the macular thickness map, as illustrated in two patients (Fig. 4).Figure 4OCT showing reduction of macular edema after treatment in Group 2.Clinical examinations and fluorescein angiographyUpon biomicroscopy examination, 9 patients were phakic. No cataracts developed on any lens during the study. At gonioscopy, neovessels at the angle or iris were not observed before and at the end of the study.Angiography at the beginning of the study revealed retinal neovessels in two patients, and one of these patients also had disc neovessels at this timepoint. At the end of the study, both patients presented with regression of the new vessels (Fig. 5).Figure 5Angiography showing regression of the retinal neovessels (red arrow).Analysis of cytokines in aqueous humorThe median values at the beginning and end of treatment were compared in Groups 1 and 2. For the control group, we used the values at the beginning of the treatment period (baseline levels) (Table 1).Table 1 Values of medians and standard deviation of cytokines in aqueous humor in the initial time of treatment (D1) and after treatment (D3), for the groups: non-ischemic and ischemic and values of the medians of the control group at baseline treatment. D1: First collection; D3: Third Collection.The values in the control group were as follows: IL-1: 0 pg/ml, IL-6: 8.23 pg/ml, IL-8: 4.66 pg/ml, IL-10: 5.57 pg/ml, IL-12: 3.4 pg/ml, TNF: 3.8 pg/ml, VFGF: 132.54 pg/ml, and b-FGF: 0.00 pg/ml (Table 1).Upon analysis of the variation in the median IL-6 level during treatment, we observed a significant increase in Group 1 at the end of the study (10.78–26.35 pg/ml, p = 0.0148).In Group 2, there was a slight decrease in the median IL-6 concentration, but the difference was not statistically significant (28.02–27.41 pg/ml, p = 0.194) (Fig. 6).Figure 6Variation in the median IL-6 level during treatment in Groups 1 and 2. D1: first collection; D2: second collection; D3: third collection.There were significant variations in IL-8 in Groups 1 and 2. The median IL-8 level increased from 13.8 ± 3.95 pg/ml to 18.15 ± 12.65 pg/ml in Group 1 (p = 0.0234) and from 15.43 ± 10.65 pg/ml to 20.8 ± 19.73 pg/ml in Group 2 (p = 0.037) (Fig. 7).Figure 7Variation in the median IL-8 level during treatment in Groups 1 and 2. D1: first collection; D2: second collection; D3: third collection.Groups 1 and 2 showed a reduction in the median IL-1 level, but these decreases were not statistically significant: Group 1, 1.61 ± 1.66 pg/ml to 0.0 ± 2.53 pg/ml, p = 0.4185; and Group 2, 0.81 ± 0.85 pg/ml to 0.56 ± 0.92 pg/ml, p = 0.441 (Table 2).Table 2 Variation of medians and standard deviation of cytokines in aqueous humor in the initial time of treatment (D1) and after treatment (D3) for groups 1 and 2.The concentrations of two interleukins, IL-10 and IL-12, were practically unchanged in both groups. IL-10 levels varied between 5.62 ± 0.70 pg/ml and 5.29 ± 1.17 pg/ml in Group 1 (p = 1.00) and between 5.71 ± 0.40 pg/ml and 5.76 ± 0.297 pg/ml in Group 2 (p = 0.626).Regarding interleukin 12, the values were 4.21 ± 0.79 pg/ml and 2.88 ± 1.60 pg/ml in Group 1 (p = 0.425) and 3.60 ± 0.44 pg/ml and 3.67 ± 0.49 pg/ml in Group 2 (p = 0.489) (Table 2).We did observe some changes in the median TNF concentration, although the values remained similar throughout the treatment period: Group 1, 4.54 ± 1.099 pg/ml and 3.16 ± 1.98 pg/ml (p = 0.155); and Group 2, 3.86 ± 0.48 pg/ml and 3.87 ± 0.47 pg/ml (p = 0.155) (Table 2).The median VEGF concentration decreased significantly in both groups: Group 1, 170.04 ± 120.54 pg/ml and 0.0 ± 57.23 pg/ml (p = 0.0039); and Group
https://www.nature.com/articles/s41598-021-03433-2
Analysis of cytokines in the aqueous humor during intravitreal Ranibizumab treatment of diabetic macular edema