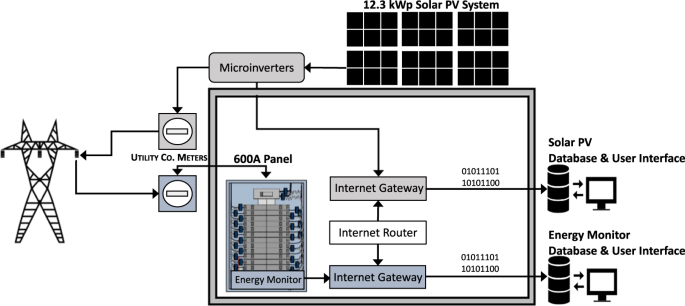
A measured energy use, solar production, and building air leakage dataset for a zero energy commercial building This paper provides an open dataset of measured energy use, solar energy production, and building air leakage data from a 328 m2 (3,531 ft2) all-electric, zero energy commercial building in Virginia, USA. Over two years of energy use data were collected at 1-hour intervals using circuit-level energy monitors. Over six years of solar energy production data were measured at 1-hour resolution by 56 microinverters (presented as daily and monthly data in this dataset). The building air leakage data was measured post-construction per ASTM-E779 Standard Test Method for Determining Air Leakage Rate by Fan Pressurization and the United States Army Corps (USACE) Building Enclosure Testing procedure; both pressurization and depressurization results are provided. The architectural and engineering (AE) documents are provided to aid researchers and practitioners in reliable modeling of building performance. The paper describes the data collection methods, cleaning, and convergence with weather data. This dataset can be employed to predict, benchmark, and calibrate operational outcomes in zero energy commercial buildings. Measurement(s) measured energy use • solar energy production • building air leakage Technology Type(s) circuit-level energy monitor • microinverter • ASTM-E779 Standard Test Method for Determining Air Leakage Rate by Fan Pressurization Factor Type(s) temporal interval Sample Characteristic – Environment zero energy commercial building Sample Characteristic – Location Commonwealth of Virginia Machine-accessible metadata file describing the reported data: https://doi.org/10.6084/m9.figshare.16869407 Significant data is generated in the built environment. Design and construction documents, performance simulations, commissioning results, and building performance data (BPD) are generated on all modern buildings. Today, system advancements in energy efficiency, integration, monitoring, and connectivity are expanding our design and facility management options throughout the built environment. Internet-enabled monitoring, ubiquitous user interfaces, machine learning, and artificial intelligence are facilitating analytical approaches not previously afforded to our industry. As buildings become more complex, the need to measure, analyze, and share BPD has become salient.Open datasets are critical for advancing building performance and analytical methods. Open BPD can be leveraged to calibrate design simulations and inform future design, construction, and operational decisions. Open BPD can facilitate benchmarking performance across building types, vintage, and geographic distributions1. Conversely, open BPD can be used to benchmark machine learning techniques for the built environment2. Simply put, open BPD is a critical component in the systems approach necessary to improve outcomes in the built environment including, but not limited to reducing carbon emissions and operating costs and improving human experiences in the built environment.The Architecture, Engineering, Construction, and Operation (AECO) industry rarely systematically collects or shares BPD. Researchers increasingly collect BPD, yet rarely share BPD in open-source data repositories3. In recent years, however, there has been a trend to develop and share open-source BPD4,5,6,7,8,9,10,11,12. For example, there are recent open BPD contributions focused on occupant behavior impacts on energy use and indoor environmental quality (IEQ).These contributions span human-building interactions with appliances5, heat pumps7, and natural ventilation systems8. Other recent contributions span energy use across building typologies (e.g., commercial and residential)9,10,11,12. This paper contributes to the recent trend toward open BPD datasets.There are two novel contributions of this work. First, the longitudinal energy use and energy production data can be employed in the pursuit of zero energy building design and performance. As we race toward zero energy buildings, open BPD become critical for reducing performance gaps between expected and realized performance. The volume and variety of small commercial buildings compounds the need to go beyond simple benchmarking exercises and requires higher resolutions of data to achieve performance targets. The second contribution of this work is the building air leakage dataset combined with longitudinal energy use and energy production data. While building air leakage is an important factor in predicting energy use, estimating heating and cooling loads, and designing for indoor environmental quality (IEQ), it is rarely available in open BPD. The balance of this paper characterizes the case study project, data collection methods, and resulting data records.This dataset was developed from a single, non-random case study project. The building serves as a leasing office and community building for a national non-profit housing provider (referred hereafter as the ‘owner’). The owner’s mission is to create homes and communities that are healthy, sustainable, and affordable. The building was designed in 2013 and construction was completed in April 2014. The owner pursued EarthCraft Light Commercial (ECLC), a regional 3rd party green building program. The ECLC program was used to verify high performance design and construction targets were achieved. Table 1 provides an overview of the building specifications and the following section characterizes the data collection techniques for the energy use (demand over time – kWh), energy production, and building air leakage data.Table 1 Building specifications.Energy useEnergy use data (demand over time – kWh) were measured using a SiteSage energy monitoring system. 150 A current transformers (CTs) were installed on the building electrical mains, while 20 A or 50 A CTs were installed on the balance of the building’s circuits depending on the circuit load (e.g., water heating, lights, heat pump). Thirty discrete circuits are measured and reported in the dataset. Each CT transmitted energy use in one-hour intervals to an internet-enabled gateway located in the electrical panel. Data was accessed via an online user interface and downloaded as a .csv file for the purposes of this data descriptor. It is important to note that for safety reasons related to accessing a live electrical panel, a licensed electrician installed the CTs in the presence of the corresponding author.Energy productionEnergy production data were measured from the building’s roof mounted, 12.3 kWp solar photovoltaic (PV) system. The solar PV system was equipped with 56 microinverters that reported production data via power line communications to an Enphase internet-enabled gateway. The microinverter production data is aggregated and reported in daily intervals. Data was accessed through an online user interface and downloaded as .csv files for the purposes of this data descriptor. The energy production monitoring system was installed by a licensed solar contractor. Access to the user interface and data was provided to the authors by the owner. Figure 1 details the sensor architecture for the energy use and energy production data collection.Fig. 1Building air leakageThe case study’s building enclosure was tested at the end of the project’s construction phase in April 2014. Building air leakage data were measured per the U.S. Army Corps of Engineers (USACE) Air Leakage Protocol for Building Envelopes13 and ASTM E779 – Standard Test Method for Determining Air Leakage Rate by Fan Pressurization14. Building air leakage rates were measured with two calibrated blower door fans, and two calibrated digital micromanometer gauges. Category 5 (CAT5) cable was used to connect the gauges to TECLOG3, a data logging software developed by the fan and gauge manufacturer. The software was also used to provide results in compliance with ASTM E779 (described in the Data Records section of this descriptor).The USACE protocol requires two tests: a multi-point depressurization test and a multi-point pressurization test. During the test, all intentional enclosure penetrations (e.g., outdoor air, make-up air, and exhaust air penetrations) are sealed with masking. Following a pre-test baseline, ten points were collected from ±20 Pa (0.08 inH2O) to ±75 Pa (0.3 inH2O) at 5 Pa (0.02 inH2O) intervals. Following each test, a post-test baseline was measured. Each point was averaged over 10 seconds. Figure 2 provides a representation of the building air leakage tests per the USACE protocol.Fig. 2USACE Building Enclosure Testing procedure.The primary and secondary data that accompany this data descriptor are provided at the Open Science Framework (OSF) respiratory15. The dataset is organized in five categories: (1) measured energy use, (2) measured energy production, (3) measured building air leakage, (4) weather, and (5) architectural and engineering (AE) documents. All data is provided in .xlsx, with the exception of the EnergyPlus weather files and AE documents. Table 2 characterizes the study’s primary data records.Table 2 Primary data output overview.To assist users of this dataset, the authors provide AE documents, publicly available weather data, and the EnergyPlus weather file (.EPW) for the case study building’s site. These data are considered as secondary data since they were not directly measured by authors. Table 3 provides an overview of the secondary data for the period of data measurements.Table 3 Secondary data overview.Energy consumptionCircuit-level energy consumption data (demand over time – kWh) were measured from June 18, 2014 to December 13, 2016. Data is organized into four datasets presenting energy use for the whole building and three end-use categories: lighting, plug & process loads (PPLs), HVAC & hot water energy use. Each dataset has circuit-level hourly data and aggregated data for total consumption for the whole building at hourly, daily, and monthly resolutions presented at separate tabs. In addition to the total energy use for the whole building and the three end-uses, energy use for first floor vs. second floor, interior vs. exterior lights, and HVAC vs. hot water are provided in the end-uses datasets in the tabs for hourly, daily, and monthly aggregated data.Monthly energy use for the whole building varies from 985 kWh to 2,482 kWh over the measurement period (with the monthly average of 1,499 kWh). Average daily energy use over the whole measurement period is 49.4 kWh per day. Higher energy use for HVAC, hot water, and interior lighting is observed in colder months with longer night hours. Seasonal variations for HVAC energy use are over 1,000 kWh while interior lighting is about 100 kWh. No major seasonal or monthly variations were observed for exterior lightings. However, there is an increase in energy use for exterior lighting from December 2014 due to a change in the control system that resulted in some of the lights being on consistently during the day. Monthly energy use for PPLs were below 300 kWh per month with a fluctuation of 100 kWh between different months from July 2014 to October 2015. No major outliers were found in the datasets. A few outliers in PPLs were observed likely due to human-building interactions. Data for energy recovery ventilation (ERV) systems are included in the dataset, but it should be noted that the ERV was unplugged by the owner within the first month of operation due to concerns related to indoor humidity.Energy productionEnergy production data for the period of May 15, 2014 to December 31, 2020 is provided in a single .xlsx file. Data is organized in daily and monthly resolutions presented at separate tabs. Although data was measured at 1-hour intervals, the hourly resolution of data is not included in this dataset as the data export function on the solar PV user interface only exports measured data in daily intervals. Daily data was aggregated into monthly data in Excel and examined for missing data. Years 2015, 2016, and 2017 have missing data for two to eight months in the year due to accidental system shutoffs. Overall, 66 months have complete data for all days in the month. Missing data were shown in grey cells in the both daily and monthly data tabs. Monthly averages over the whole 7-year period and a 3-year period with complete data for all months of the year (2018 to 2020) are also provided in the monthly data tab. Minimum, maximum, and average values for daily energy production are provided in the daily data tab.The Annual average of energy production is 1,218 kWh for years without missing data (2018 to 2020). More than 1,000 kWh energy is produced in a month from March through October. More energy production, however, was observed in April to August with July having the highest energy production on average over 7 years of data measurement. The highest monthly energy production was recorded as 2,213 kWh in May 2015. Figure 3 presents variations in daily energy production from August 2014 to May 2015.Fig. 3Example of daily energy production data. Lighter shades of represent higher energy production.Building air leakageBuilding air leakage data is provided in a single .xlsx file. The USACE protocol and ASTM E779 standard require the reporting of both depressurization and pressurization tests. Results are separated by tab in the file. Each test (e.g., tab) reports three columns of data: (1) test point, (2) average induced enclosure pressure (+/− 75 Pa), and 3) total corrected fan flow (CFM).Weather dataAn EnergyPlus weather file (.EPW) for Charlottesville, VA is provided for building energy simulation applications16. Measured weather data for Charlottesville, VA provided by Weather Underground website17 from June 2014 to December 2016 is also available in the OSF respiratory. Daily and monthly resolutions of weather data are provided into two separate subfolders in the respiratory. Weather data includes temperature, dew point, humidity, wind speed, pressure, and precipitation. Daily weather data in the .xlsx file is provided in separate tabs for each month of the energy use measurement period. The average for each month is presented in the last row in the tab for that month. Monthly weather data includes heating degree days (HDDs) and cooling degree days (CDDs) and is provided in both SI and IP unit systems. The base temperature was 18 °C (65 °F) for both HDDs and CDDs. To facilitate investigating of the correlation between solar radiation and solar energy production, solar radiation data is provided from the National Oceanic and
https://www.nature.com/articles/s41597-021-01082-8
A measured energy use, solar production, and building air leakage dataset for a zero energy commercial building