A resource summary is provided in Supplementary Table 14.
Dataset description
To explore the diversity of archaea in human gastrointestinal samples, we compiled publicly available genomes from four recent collections of MAGs2,25,26,27,57. Briefly, the Unified Human Gastrointestinal Genome (UHGG) collection (data access June 2020, https://www.ebi.ac.uk/metagenomics/genomes) holds published, nonredundant MAGs and isolates, collected from public repositories and associated metadata information (see ref. 2 for more details). No statistical methods were used to predetermine sample sizes. We additionally included published genomes from cultured archaea available in the National Center for Biotechnology Information (NCBI)58, Pathosystems Resource Integration Center (PATRIC)59 and Integrated Microbial Genomes and Microbiomes (IMG/M)60 repositories.
Genomes were compared using Mash v.2.1 (ref. 61) and, for genomes that were estimated to be identical and had a Mash distance of 0, only one was selected. In addition, we included genomes of ‘Ca. Methanomethylophilus alvus’15 and ‘Ca. Methanomassiliicoccus intestinalis’14, as well as human gut-derived MAGs of Methanomassiliicoccales Mx02, Mx03 and Mx06, and additional ‘Ca. M. intestinalis’16, and the human isolate Methanobrevibacter arboriphilus ANOR1 (ref. 42) to complete the dataset. Those genomes were assigned a genome accession no. (GUT_GENOME286998, GUT_GENOME287001, GUT_GENOME287002, GUT_GENOME287004), as given in Supplementary Table 1a. This brought the total number of genomes used for the analysis in the present study to 1,167. Data collection and analysis were not performed blind to the conditions of the experiments.
Genome quality and taxonomic classification
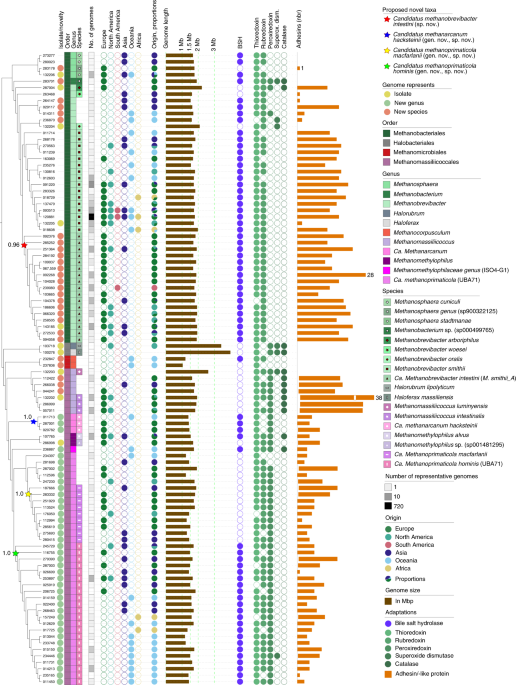
The completeness of the nonredundant 1,167 genomes was evaluated by CheckM v.1.0.11 (ref. 62) and only genomes that were >50% complete and had <5% contamination were selected (following the protocol from ref. 2; Extended Data Figs. 1 and 2a–c). This procedure yielded 1,167 nonchimeric63 (clade separation score (CSS) = 0; Supplementary Table 1a) and nonredundant archaeal genomes (Mash distance threshold of 0.001, 99.9% ANI61; Supplementary Table 1a) which were further subgrouped into individual strains (75% genome completeness; Supplementary Table 1b; 98 genomes; Fig. 1), and species (75% genome completeness; Supplementary Table 1c; 27 genomes). For this, the best quality genome (genome completeness, minimal contamination, strain heterogeneity and assembly continuity based on the N50 value) from each cluster was selected as representative or, whenever an isolate was available, it was preferred and used for further analysis.
Read mapping was performed with Bowtie2 (ref. 64) for the genomes that had original raw reads available and were post-processed using samtools65. Strain heterogeneity within each MAG was computed using the script ‘polymut.py’ from the CMseq tool (https://github.com/SegataLab/cmseq). Alignment files were used together with the parameters –minqual 30 and –cov 10, following the method description in refs. 2,25. A threshold of ≤0.5% indicates heterogeneity of assembly and the higher likelihood of one strain present per assembly. GUNC63 was used to detect chimerism in all 1,167 genomes and resulted in a CSS of 0 for all genomes (Supplementary Table 1e). A CSS closer to a value of 0 indicates that a genome is free of contamination and all genes are assigned to the same taxonomy, whereas a CSS score closer to 1 indicates chimerism. The CSS, taken together with the contamination thresholds from CheckM, demonstrated that our 1,167 genomes were not chimeric in nature.
DRep v.2.0.0 (ref. 66) was used to dereplicate the complete dataset at 95% and 99% ANI values. The 95% ANI values were selected to separate between species boundaries (n = 27)67. A cut-off of 99% was selected for strain delineation, provided that a stable number of clusters for MAGs >75% complete had <5% contamination (n = 98; Extended Data Fig. 3a). Lower thresholds did not affect the number of strains recovered. The resulting strain and species representatives are given in Supplementary Table 1a-c.
All genomes were taxonomically annotated following the procedure given in ref. 2. The taxonomic assignment was performed using the GTDB Toolkit v.0.3.1 (database release 04-RS89)68 and default parameters that utilize a set of 122 marker genes to identify archaeal MAGs. Previously undescribed species and genera were defined when no taxonomic information was assigned for all members of a species cluster and their species representatives based on the GTDB database. The methodology is detailed in Supplementary Fig. 1.
Genome annotation and protein catalogue
Protein-coding sequences (CDSs) were predicted and annotated with Prokka v.1.14.5 (ref. 69) using the parameters ‘–kingdom Archaea’ to include nonfragmented archaea-curated proteins from the UniProtKB database and ‘–rfam’ to scan for noncoding RNAs. CDSs were further characterized using eggNOG-mapper v.2.0.0 (ref. 70) and the eggNOG database v.5.0 (ref. 71), which includes the latest release of all archaeal clusters of orthologous groups and their proteins72.
The protein catalogue was generated by combining all predicted CDSs (total number 1,790,493) derived from the 1,167 nonredundant archaeal genomes. MMseqs2 linclust73 was used to cluster the concatenated proteins dataset using the options ‘–cov-mode 1 -c 0.8′ (minimum coverage threshold of 80% the length of the shortest sequence) and ‘–kmer-per-seq 80′. Proteins were clustered at different percentage identities and the number of unique proteins resulting per clustering for each taxonomic family was computed and visualized (Extended Data Fig. 3b). To reduce the risk of contaminants, the proteins were filtered to remove all nonclustered proteins. This gave a total of 28,581 proteins clustering at 50% identity (Supplementary Material 1) visualized using the library pheatmap74 in R. MMseqs2 using the ‘easy-search’ was additionally used for aligning the 28,581 proteins to UniRef 50 (ref. 75) (date of download January 2021) to verify predicted proteins that resulted in 13,254 (46.37%) proteins with a hit.
In addition to the protein catalogue, the various species and strain subsets of the total 1,167 archaeal genomes (Supplementary Table 1b,c) were submitted to MaGe MicroScope (Microbial Genome Annotation & Analysis Platform76), for detailed analyses of genomic synteny, and the detection of bile salt hydrolases, oxygen resistance genes and adhesins, following the automated annotation of MaGe (Supplementary Table 1f).
Relative abundance of archaea in human metagenomes
Raw read datasets (691) were obtained from studies of the human gut microbiome, out of which 691 (of 1,167) medium- or high-quality archaeal MAGs were assembled. The remainder was not made public by their original submitters (Supplementary Table 1a).
We mapped raw reads to the 27 reference archaeal species representatives using Bowtie2-align64 and post-processed using samtools65. The generated sorted mapping files were used to calculate the breadth of coverage. Breadth of coverage was calculated by dividing the total number of bases covered (using samtools mpileup) by the length of the reference genome. To get the percentage coverage breadth we multiplied the resulting number by 100.
For measuring the relative abundance of the 27 archaeal species in the different metagenomics datasets we used CoverM (https://github.com/wwood/CoverM) and the relative_abundance calculation method (Supplementary Table 2f).
Reads were additionally mapped using Kraken v.2.1.2 (ref. 77) (with default settings) against (1) a custom database of the UHGG catalogue available from the MGnify FTP site (http://ftp.ebi.ac.uk/pub/databases/metagenomics/mgnify_genomes/human-gut/v1.0/uhgg_kraken2-db) and (2) a customized database of the 27 archaeal species representatives in our dataset because we supplemented the initial resource with additional isolates (Data description). Results were processed using Bracken v.2.5.3 (ref. 78) using both read lengths 100 and 250 to estimate the relative abundance of domain-, family- and species-level taxa (Supplementary Table 2b–d). We did not observe differences in the output values of the analysis between read lengths 100 and 250.
Protein abundance estimation
To avoid estimations based on potential false negatives derived from sample processing or genome binning, all raw reads were aligned on the unified archaeal protein catalogue using DIAMOND BLASTx79. The hits were counted and the result was transformed into a matrix of the number of hits for each protein per study using the pandas library80. This resulted in a mapped protein matrix used for further statistical analysis to minimize the risk for sample or batch effects in our dataset (Supplementary Material 2).
Besides genomic information (genome length, number of contigs, N50, GC content, genome completeness, genome contamination, and number of rRNAs and transfer RNAs), 11 metadata categories (numerical 2, categorical 9) could be considered for the dataset. Information about the geographic origin was available for 1,063 genomes (91% of the dataset covered countries from maximum to minimum: the USA, Israel, Spain, Sweden, Fiji, UK, Austria, Denmark, the Netherlands, France, China, Peru, Germany, Madagascar, United Republic of Tanzania, Australia, Canada, Ireland, Italy, Russia, El Salvador, Iceland, Mongolia, Norway, on five continents; Supplementary Table 1d and Fig. 3a).
Information on lifestyle was available for 1,054 genomes (90%, max.–min.: urban, rural, semi-urban), health state (healthy, diseased) for 894 genomes (77%), age group (adult, elderly person, child, teenager, infant) for 825 genomes (71%), gender (female, male) for 620 genomes (53%), BMI group (normal weight, overweight, obesity class 1, underweight, obesity class 2, extreme obesity class 3) for 505 genomes (43%) and name of disease (colorectal cancer, infection, type 2 diabetes, adenoma, obesity, ulcerative colitis, nonalcoholic fatty liver disease (NAFLD), Parkinson’s disease, ankylosing spondylitis—arthritis, faecal microbiota transplantation (FMT), cirrhosis) for 303 genomes (26%) and treatment (antibiotics) for 241 genomes (21%). However, most genomes (third quartile, 75% of all values) were obtained from healthy women of normal weight, living in urban areas of Europe (Fig. 3).
To overcome biases introduced by potential residual MAGs contamination issues, we focused our analyses on patterns observed in two or more genomes, unless stated otherwise. In addition, we explored protein diversity patterns and their functional characterization among isolated genomes to corroborate those observed in MAGs. Finally, to avoid estimations based on potential false negatives derived from sample processing or genome binning, raw reads were mapped on the unified archaeal protein catalogue (Supplementary Material 1) as a reference to generate a mapped protein matrix (Supplementary Material 2), which minimized the risk for sample or batch effects in our dataset.
Supervised classification and regressions with RandomForest were applied to predict respective metadata categories from the unified archaeal protein catalogue and the mapped protein matrix with the q2-sample-classifier plugin81. To reduce the risk of overfitting, the matrices were downsampled to a minimum of 50 genomes for each tested metadata category, as recommended by scikit-learn 0.24.1 (ref. 82). First subsets of each metadata category were created from the entire protein matrix and randomly split into a training set and a test set with the proportions 80%:20%. By using K-fold cross-validation, the training set served as a learning model to predict class probabilities with settings for optimized feature selection and parameter tuning. In the end, model accuracy was determined by comparing the predicted values between the training and test datasets.
Pan-genome analysis
Pan-genome analysis was performed using Panaroo83 in ‘strict’ mode because it accounts for potential annotation errors, fragment assemblies and contaminated genomes to recover an accurate pan-genome. Pan-genome analysis was performed for archaeal genomes of the same families and the same genus. We used Heaps’ law (η = κ × n − α) to estimate whether we had an open or a closed pan-genome84, This analysis was carried out in the R package ‘micropan’85 using a default permutation value of 100, where η is the predicted number of genes for a particular number of genomes (n), and κ (intercept parameter) and α (decay parameter) are the constants used to fit the curve after the genomes have been ordered in a random way. An open pan-genome is indicated by α 1.
Estimation of growth rates
Growth rates were estimated using GRiD86 in the multiplex mode (minimum coverage = 1 and reassignment of ambiguous reads) by a customized GRiD database based on the created subset of high-quality archaeal genomes on species level. As the original raw reads were not available for each representative genome and the remaining read sets were not made publically available, growth rate estimates covered 131 metagenomic read sets (70% of all archaeal genomes grouped at strain level).
In-depth taxonomic and clustering analyses of the various genera
ANI distances and tree matrices were calculated using the online resources of the enveomics platform87, MaGe76, as well as Microbial Genomes Atlas (MiGA)88. Dendrograms, built on the ANI tree matrix, were annotated using the iTOL tool (Interactive Tree Of Life)89, and processed using InkScape. For specific considerations involving additional genomes from animals, a subselection of the archaeal genomes was reanalysed together with the additional genomes following the same settings as described for the protein catalogue procedures above (respective datasets are given in the Supplementary Table 12).
McrA genes were extracted via MaGe, hosting all strain-level genomes (Supplementary Material 4). McrA genes were aligned using MegaX90, and a maximum likelihood tree was calculated (default settings).
Bacterial and archaeal BSH genes were derived from ref. 91 and supplemented with BSH genes from genomes in the present study. Sequences were cropped and a tree was calculated using the MEGA-X Maximum Likelihood Phylogeny Reconstruction. The tree was annotated using the iTOL tool89.
Initial HGT analysis
Representative genomes from isolates and MAGs with 0% contamination according to CheckM results were selected for these analyses (Methanosphaera spp.: 8 from humans, 7 from animals; Methanobrevibacter spp.: 30 from humans, 11 from animals). A list with full details is provided in Supplementary Table 11. Genomes from animals were obtained from NCBI (ncbi.nlm.nih.go/genome), representing all available high-quality genomes (isolates, MAGs) of the respective genus at the time point of analysis (2020; Supplementary Table 11). The selected genomes were further characterized as previously mentioned using eggNOG-mapper v.2.0.0 (ref. 70) and the previously mentioned databases (Genome annotation and protein catalogue). Annotated genes were sorted according to their taxono
https://www.nature.com/articles/s41564-021-01020-9