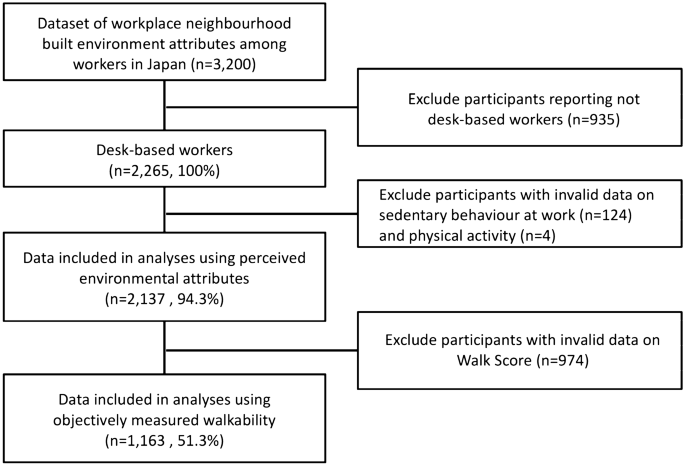
Workplace neighbourhood built-environment attributes and sitting at work and for transport among Japanese desk-based workers Chien-Yu Lin1, Mohammad Javad Koohsari2,3, Yung Liao2,4, Kaori Ishii2, Ai Shibata5, Tomoki Nakaya6, Gavin R. McCormack2,7, Nyssa Hadgraft8, Takemi Sugiyama8,9, Neville Owen8,9 & Koichiro Oka2 Scientific Reports 12, Article number: 195 (2022) Cite this article Environmental social sciencesHealth occupations Workplace settings—both internal and external—can influence how workers are physically active or sedentary. Although research has identified some indoor environmental attributes associated with sitting at work, few studies have examined associations of workplace neighbourhood built-environment attributes with workplace sitting time. We examined the cross-sectional associations of perceived and objective workplace neighbourhood built-environment attributes with sitting time at work and for transport among desk-based workers in Japan. Data were collected from a nationwide online survey. The Abbreviated Neighborhood Environment Walkability Scale (n = 2137) and Walk Score® (for a subsample of participants; n = 1163) were used to assess perceived and objective built-environment attributes of workplace neighbourhoods. Self-reported daily average sitting time at work, in cars and in public transport was measured using a Japanese validated questionnaire. Linear regression models estimated the associations of workplace neighbourhood built-environment attributes with sitting time. All perceived workplace neighbourhood built-environment attributes were positively correlated with Walk Score®. However, statistically significant associations with Walk Score® were found for sitting for transport but not for sitting at work. Workers who perceived their workplace neighbourhoods to be more walkable reported a longer time sitting at work and in public transport but a shorter sitting time in cars. Our findings suggest that walkable workplace neighbourhoods may discourage longer car use but have workplaces where workers spend a long time sitting at work. The latter finding further suggests that there may be missed opportunities for desk-based workers to reduce sitting time. Future workplace interventions to reduce sitting time may be developed, taking advantage of the opportunities to take time away from work in workplace neighbourhoods. Socio-ecological models suggest that urban design factors can play an important role in influencing physically active and sedentary behaviours1,2. Building on a growing body of evidence on urban design attributes related to physical activity, a recent science advisory statement from the American Heart Association recognised the role of activity-supportive neighbourhood built environment design in promoting active living and improving population health3. Such urban design strategies may have relevance for desk-based workplaces, where many workers spend most of their work hours sitting4,5. In addition to the indoor environment of such workplaces, in which some characteristics are known to be related to workers’ sitting time6,7, the external environment surrounding the workplace may also be relevant in this context. Given that occupational sitting tends to be accumulated in long bouts5,8, workplace neighbourhoods with opportunities for walking or to otherwise being away from the office environment may be conducive to lower amounts of sitting at work.Two recent reviews have synthesised findings on the associations of workplace neighbourhood built-environment attributes with workers’ sedentary and active behaviours9,10. Zhu et al.9 found inconclusive evidence for associations of physical activity with most workplace neighbourhood attributes such as population density and access to destinations. Lin et al.10 found that longer distances from the workplace to home and better access to car parking around the workplace were associated with longer time spent driving to/from work. However, the majority of previous studies of workplace neighbourhood built-environment attributes examined physical activity but not sedentary behaviour. Furthermore, the studies on sedentary behaviour and workplace neighbourhoods examined sitting in cars rather than sitting at work. Previous reviews have shown that the relevant environmental correlates may differ between different domains of sedentary behaviour11. Identifying correlates of sedentary behaviours at work and for transport that add to the total volume of daily sedentary time can assist in developing health promotion strategies relevant to desk-based workers.Few studies have investigated the associations between the workplace neighbourhood built environment and physical activity and sedentary behaviour in the Asian context. In their review, Lin et al.10 found that only three out of 55 studies were conducted in Asian countries, of which all three studies investigated physical activity. Evidence from Asian countries is needed, as workplace cultures and contexts are likely to differ between Asian and Western countries. One such difference is hours spent at work: the average work hours per week in workers, both full-time and part-time employed, from Asian countries such as China (46 h), South Korea (40 h), and Japan (38 h) are longer than the hours in Western countries such as the USA (37 h) and the UK (36 h)12. Another difference is the built environment where the workplace is situated. Compared with cities in Western countries, built environment patterns (e.g., street network, land use, and access to public transport) are likely to be different, primarily due to the higher population densities in Asian countries13. Such differences between Western and non-Western cities warrant investigation of workplace neighbourhood environments and transport-related sitting in an Asian context.This study examined the associations of perceived and objective measures of workplace neighbourhood built-environment attributes with workplace and transport-related sedentary behaviours among desk-based workers in Japan.This study follows the STrengthening the Reporting of OBservational studies in Epidemiology (STROBE) guidelines for reporting observational studies.ParticipantsData from an online survey conducted through a Japanese internet research service company (MyVoice Communication, Inc. Tokyo, Japan) in February 2019 was used for the study. This company retains some one million individuals across Japan voluntarily registered as panel members with detailed socio-demographic data. Potential participants aged 20–59 years with full-time jobs (n = 45,659) were randomly selected from the database and received an invitation email about this study via their company’s system. These potential participants were equally stratified by gender and age groups (20–29, 30–39, 40–49, and 50–59 years) to minimise the possibility of selection bias due to being overrepresented in specific demographic subgroups. They received an email invitation with a specific link to access an online questionnaire. A total of 3200 workers signed an online informed consent form and completed the questionnaire (response rate = 7.0%). Each participant received reward points valued at 1.5 USD as an incentive after they completed the survey. The analysis was limited to the participants who reported desk-based employment (n = 2265). All methods used in this study were in accordance with the relevant ethical guidelines. The Institutional Ethics Committee of Waseda University (2020–135) approved this study.A validated Japanese questionnaire14, which seeks to assess sedentary time in six specific behaviours across three domains (related to work, transport, and leisure) separately for workdays and non-workdays, was used (see Supplementary Table 1 for the full questionnaire). Participants were asked to report their daily average sedentary time for each behaviour over the previous week. We used three specific sedentary behaviours on workdays as the outcome measures: sitting time at work; sitting time in cars; and sitting time in public transport. These behaviours were considered to occur in or near participants’ workplace neighbourhoods, as workers carried them out on workdays. This questionnaire has shown moderate to high test–retest reliability (intraclass correlation coefficient [ICC] = 0.83) for the work domain with a 1-week recall period14. The criterion validity of all-domain sedentary time for workdays (rho = 0.57, p < 0.001) and the whole week (rho = 0.49, p < 0.001), comparing the questionnaire with accelerometer, is moderate14.Exposure variablesPerceived workplace neighbourhood built environmentThe Abbreviated Neighborhood Environment Walkability Scale Japanese version (ANEWS-J) was used to measure environmental perceptions in the workplace neighbourhood. Workplace neighbourhood was defined as within a 10- to 15-min walk from the workplace. A total of six subscales were assessed: land use mix diversity (16 items), land use mix access (6 items), street connectivity (3 items), availability and quality of walking/cycling infrastructures (4 items), aesthetics (4 items), and crime safety (5 items). The Cronbach's α, an indicator of internal consistency, for land use mix diversity, land use mix access, street connectivity, availability and quality of walking/cycling infrastructures, aesthetics, and crime safety were 0.91, 0.65, 0.64, 0.72, 0.73, and 0.56, respectively. We did not include the subscales of residential density, which was not applicable to the study, and traffic safety due to low internal consistency (α = 0.26)15. The details of the modified ANEWS-J used in this study were provided in Supplementary Table 2. All subscale items were rated on a four-point scale, except for those to assess land use mix diversity (six-point scale). Scoring the subscales followed the procedures of ANEWS-J published online (http://www.tmu-ph.ac/pdf/ANEWS_Jpn_ver3.pdf). Higher scores indicate greater walkability. ANEWS-J has been found to have acceptable test–retest reliability (ICCs = 0.76–0.96) for residential neighbourhoods16. We examined the test–retest reliability of ANEWS-J for workplace neighbourhood in a subsample of participants (n = 200). Participants reported their perceptions of their workplace neighbourhood environment twice within two weeks. The test–retest reliability of ANEWS-J was moderate to high for all subscales (ICC = 0.57–0.87) (Supplementary Table 3).Objectively measured workplace neighbourhood walkabilityThe level of walkability in workplace neighbourhoods was estimated using Walk Score®. It is a measure of access to local destinations, using a distance-decay function to destinations such as grocery stores, restaurants, banks, parks, and schools, with adjustment by two street connectivity metrics: intersection density and block length17. Walk Score® can be assigned to locations (e.g., postcodes or addresses) and is normalised between 0 and 100. A higher Walk Score® indicates that there are more destinations within walking distance. Walk Score® uses open-source data such as Google, Education.com, and Open Street Map as the source data to identify relevant destinations17. Walk Score® has been confirmed as a valid measure to assess neighbourhood walkability in Japan18. Around 60% of the participants provided their seven-digit workplace postcodes (n = 1360), with 777 unable to provide their complete workplace postcodes. Each workplace postcode was manually entered into the Walk Score® website (www.walkscore.com) to obtain the score in July–August 2020. Walk Score® was available for 1163 participants. The website did not generate Walk Score® for 197 participants who provided a workplace postcode due to the limited data for spatial details from Japan. Since Walk Score® was negatively skewed (median score = 82, 25th percentile = 63, 75th percentile = 94), we used Walk Score® as a categorical measure. We classified participants into three groups according to Walk Score®: car-dependent (0–69); somewhat walkable (70–89); and very walkable (90–100).CovariatesIndividual-level covariates included gender, age group (20–29, 30–39, 40–49, or 50–59 years), marital status (not married or married), educational level (tertiary education or below tertiary education), individual annual income (< 4,000,000 or ≥ 4,000,000 yen), physical activity duration, and work hours per week. We used the Global Physical Activity Questionnaire (GPAQ)19 to assess the amount of physical activity in three domains (work, transport, and leisure). The GPAQ data were checked for valid responses following the standardised procedures provided by the World Health Organization20. The total amount of physical activity for these domains was used as a covariate. Four more participants were excluded due to missing data on total physical activity. Information on the possession of a driving licence (yes/no) was also collected for transport-related sedentary behaviours. The work hours were assessed using the question 'How many hours have you worked in the last 7 days?' The workplace-level covariate was workplace size, which was measured by the self-reported number of workers in the participant's workplace (< 29, 30–99, ≥ 100 employees, or missing).Statistical analysisDifferences in characteristics across subsample categories were examined using Pearson's Chi-square tests for categorical variables and independent t-tests for continuous variables. Spearman's correlation was used to examine the correlations between perceived workplace neighbourhood built-environment attributes and Walk Score®, as the latter was skewed.We used linear regression models to investigate the associations of workplace neighbourhood attributes with sedentary behaviour at work. The unstandardised regression coefficients (β) and 95
https://www.nature.com/articles/s41598-021-03071-8
Workplace neighbourhood built-environment attributes and sitting at work and for transport among Japanese desk-based workers