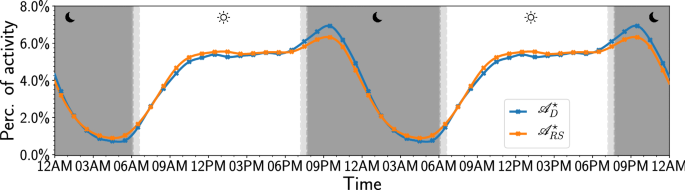
Depression alters the circadian pattern of online activity Human sleep/wake cycles follow a stable circadian rhythm associated with hormonal, emotional, and cognitive changes. Changes of this cycle are implicated in many mental health concerns. In fact, the bidirectional relation between major depressive disorder and sleep has been well-documented. Despite a clear link between sleep disturbances and subsequent disturbances in mood, it is difficult to determine from self-reported data which specific changes of the sleep/wake cycle play the most important role in this association. Here we observe marked changes of activity cycles in millions of twitter posts of 688 subjects who explicitly stated in unequivocal terms that they had received a (clinical) diagnosis of depression as compared to the activity cycles of a large control group (n = 8791). Rather than a phase-shift, as reported in other work, we find significant changes of activity levels in the evening and before dawn. Compared to the control group, depressed subjects were significantly more active from 7 PM to midnight and less active from 3 to 6 AM. Content analysis of tweets revealed a steady rise in rumination and emotional content from midnight to dawn among depressed individuals. These results suggest that diagnosis and treatment of depression may focus on modifying the timing of activity, reducing rumination, and decreasing social media use at specific hours of the day. Depression is one of the most important global public health challenges. It is the single largest contributor to disability and disease, affecting 4% of the world’s population, causing 11% of all years lived with disability globally1. It is furthermore associated with a reported 800,000 suicides on an annual basis, mostly among young adults2. Depression is significantly under-reported, under-diagnosed, and under-treated, in part due to its heterogeneous nature which involves subjective and culturally shaped experiences such as motivation, mood, and well-being3. Furthermore, in spite of its prevalence, the dynamics of its onset and development remain poorly understood4,5,6, limiting the development of treatment options7,8.Like most mammals9, humans experience circadian rhythms involving hormonal, behavioral, and cognitive changes that lead to stable sleep-wake cycles, even when individuals are disconnected from natural daylight10,11 or travel across time zones. Unsurprisingly, a stable daily activity cycle is important to maintain physical and mental health12,13. In fact, disturbances of the human circadian rhythm are strongly associated with mood disorders14,15,16,17,18,19,20,21,22 such as depression and anxiety, bipolar, and borderline personality disorder. The severity of depression has been linked to the magnitude of the sleep-wake cycle disturbance23 while reports of sleep disturbances can be used as an early warning signal of recurrent depression24 and predict risk of poor outcomes in treatments for depression25. As a result, interventions targeting sleep are now considered an essential component of efforts to improve depression treatment outcomes26,27. This is also emphasized by the central position of sleep-related symptoms in disorder networks28.Although the connection between sleep-wake cycle disturbances and depression has been firmly established, it is not clear which specific disturbances or changes are most strongly implicated in the onset and remission of depression. Reports of the effectiveness of sleep deprivation therapy29,30 indicate that the association between sleep and mood disorders is not necessarily modulated by the amount of sleep per se31, but by its specific timing and pattern. In particular, questions have arisen with respect to whether phase and/or magnitude changes of the sleep-wake cycle account for the association between sleep and risk for depression32.Observations of daily activity levels of individuals require continuous monitoring of a large number of subjects throughout numerous circadian cycles to establish sufficient statistical power while avoiding observer bias. However, most studies establishing circadian rhythm disturbances in mental disorders suffer from small sample sizes33. These limitations can be mitigated by the post hoc analysis of alternative sources of information such as microblogs, diaries, mobile phone34, and social media activity. The latter in particular serve as a daily cognitive and behavioral diary to billions of individuals. In fact, activity levels in on-line platforms, e.g. using Digg35, Foursquare36, Twitter37, Wikipedia editing behavior38, and YouTube35, have already proven to be a useful resource to estimate circadian cycles.Here, we use large-scale, longitudinal, social media activity data to study the daily activity cycles of hundreds of individuals who stated in unequivocal terms that they had received a (clinical) diagnosis of depression, using an similar sample inclusion criterion as Coppersmith, Dredze & Harman39. We find that the activity levels of depressed individuals, like those of a random sample, fluctuate reliably according to a well-defined circadian rhythm as was shown previously40. Our results extend these findings by showing no evidence of a significant phase-shift, but rather that activity levels for the depressed individuals differ significantly in the early evening and early morning hours, which is when we also see increased indications of emotionality and self-reflection. These findings point towards targeted interventions that focus on the reduction of rumination at specific times of the day.For our analysis, we define 2 disjoint cohorts of Twitter users: ‘Depressed’ and ‘Random’. In our ‘Depressed’ cohort we only include individuals with a (clinical) diagnosis of depression, which they report on Twitter explicitly (e.g., ‘Went to my doctor today and got officially diagnosed with major depression’), similar to the approach of Coppersmith, Dredze & Harman39. A team of 3 raters independently evaluated each ‘diagnosis tweet’ to determine whether it pertained to an explicit, unequivocal statement of an actual diagnosis, removing self-diagnoses, retweets, quotes, or jokes. In other words, we excluded individuals who ‘self-diagnosed’ with depression. This second step was taken to remove false-positives from the cohort, which has been proven to increase performance in classification tasks41. We also mapped references to a time of diagnosis, e.g. ‘today’, ‘last week’, ‘2 months ago’, or ‘in 2014’ to a likely diagnosis time interval (see ‘Methods’). This method is akin to research on electronic health records (EHRs) as well as pharmacoepidemiological methods in the sense that we rely on reports of an actual diagnosis but are receiving this information directly from the individual with the diagnosis. This allows us to tie the diagnosis to their social media record, which provides indicators of their evolving mood, cognition, language, and behavior. While the recognition of depression is poor in some settings42, patients who are recognized as being depressed tend to, on average, have higher levels of depression than those who are not recognized43. This finding, along with research suggesting depression is best understood as existing on a continuum (for a review see Ruscio44), supports the validity of our inclusion criteria for the ‘Depressed’ cohort. We found 688 individuals that explicitly stated their (clinical) depression diagnosis and whom we assigned to the ‘Depressed’ cohort, or D cohort for short. We downloaded the past tweets of these aforementioned individuals to obtain a longitudinal timeline.Neither the reported diagnosis nor the Twitter profiles of the sampled individuals provide demographic information with respect to our D cohort. However, a highly accurate sex classifier45 (Macro-F1: 0.915) applied to the Twitter profiles of our D cohort (see ‘Methods’), shows that it has a similar 2:1 female to male ratio as observed in clinical studies46, indicating that the demographics of our Twitter cohort closely match previous clinical findings. The indicated age distribution of our D cohort (though less reliable, Macro-F1: 0.425), is also in line with clinical studies46,47, specifically we find a decreasing number of individuals per age-group as the age of the group increases in our D cohort.Table 1 Demographic information derived with M345 for both cohorts.We define our ‘Random’ cohort, or RS cohort for short, as a control group by taking a random sample of 8791 Twitter users. To compensate for possible changes of user behavior in the social media platform over time, we sample these individuals such that the distribution of their account creation month matches that of the individuals in the D cohort (see Supplementary Information Section 2). Table 1 describes the demographic information obtained for both cohorts.We assume that sleeping individuals can not tweet and that we can therefore gauge changes in activity levels by counting the number of tweets that an individual posts at a given time. Working at an hourly resolution, we count the number of tweets that an individual has posted at a given hour of the day and divide each hourly count by the total number of tweets for all hours of the day. This results in an hourly percentage of daily Twitter activity for the individual (denoted ({mathscr {A}}_u)). We can then calculate a cohort hourly activity level for either the D cohort or the RS cohort, denoted ({mathscr {A}}_D) or ({mathscr {A}}_{RS}), respectively, by combining all hourly counts across the individuals in the specific cohort and dividing by the total number of tweets across these individuals. Note that we exclude retweets and account for each individual’s local time to ensure counts pertain to the same time of day.Naturally, differences can arise in the level of activity between both individuals and cohorts in general. Since we are not looking to make inferences about the total amount of tweets nor the average number of tweets per cohort, but rather the relative differences of hourly activity patterns between the two cohorts, we account for this variation by calculating hourly activity levels for 10,000 re-samples of the individuals in the D and RS cohorts with replacement, i.e. we bootstrap hourly activity levels for each cohort. This re-sampling results in a distribution of activity levels for each hour (each from a different sample of individuals) that can be characterized by its median and 95% confidence interval, denoted by ({mathscr {A}}^star _D) and ({mathscr {A}}^star _{RS}) respectively for the D and RS cohort.Figure 1Bootstrapped normalized activity levels for the ‘Depressed’ and ‘Random’ cohorts. The markers display the median outcome of 10,000 runs, where we use the number of individuals in each cohort as the sample size per run ((n=688) for the ‘Depressed’ and (n=8791) for the ‘Random’ cohort). The solid lines display the cubic spline fit of these hourly values. The dark and light gray shaded areas indicate the day/night times during the cycle (see ‘Methods’).Figure 2Bootstrapped difference between the normalized activity levels for the ‘Depressed’ and ‘Random’ cohorts. (A) Relative difference between the ‘Depressed’ and ‘Random’ cohorts. The markers indicate the hourly relative difference between the mean activity levels (see Fig. 1) for both cohorts and the solid black line displays the cubic spline fit of these hourly values. (B) Bootstrapped difference between the ‘Depressed’ and ‘Random’ cohorts. The diamonds display the median outcome of the difference in outcome of the 10,000 runs and the vertical lines display the 95% CI of the difference in the bootstrap outcomes. The hours displayed in bold indicate that there is a significant difference in behavior between the two cohorts. Furthermore, the gray shaded areas in both panels indicate the hours in which there is a significant difference in activity and the black dashed lines in both panels are meant as a reference lines that indicate equal behavior for both cohorts.Figure 3Z-score normalized relative difference in token usage between the ‘Depressed’ and ‘Random’ cohorts. The Z-score normalized hourly values of (PR^hleft( {{mathscr {C}}_x}right)) for all selected tokens and each category are indicated by the colored markers (see SI Section 5 for the actual values). The solid lines display the cubic spline fit of the hourly values. The black dashed line is a visual representation of the mean behavior. Furthermore, the gray shaded areas indicate the hours in which there is a significant difference in activity.The resulting time series ({mathscr {A}}^{star }_D) and ({mathscr {A}}^{star }_{RS}) are displayed in Fig. 1. As a reference to aid the eye, we show the times of dawn, sunrise, sunset and dusk as gray bands. We repeat the cycle twice in Fig. 1 to better highlight the daily variation around midnight.For both the D and RS cohorts, we find periodic changes in activity levels throughout the day, resulting in a well-defined circadian rhythm of activity levels. We find that both cohorts experience a valley in activity levels from roughly 10PM to 6AM, a time that is traditionally reserved for sleep. Activity levels quickly recover from a low point at 6AM as people wake up and become active during the morning hours.
https://www.nature.com/articles/s41598-020-74314-3
Depression alters the circadian pattern of online activity