Physiological and root anatomical assay
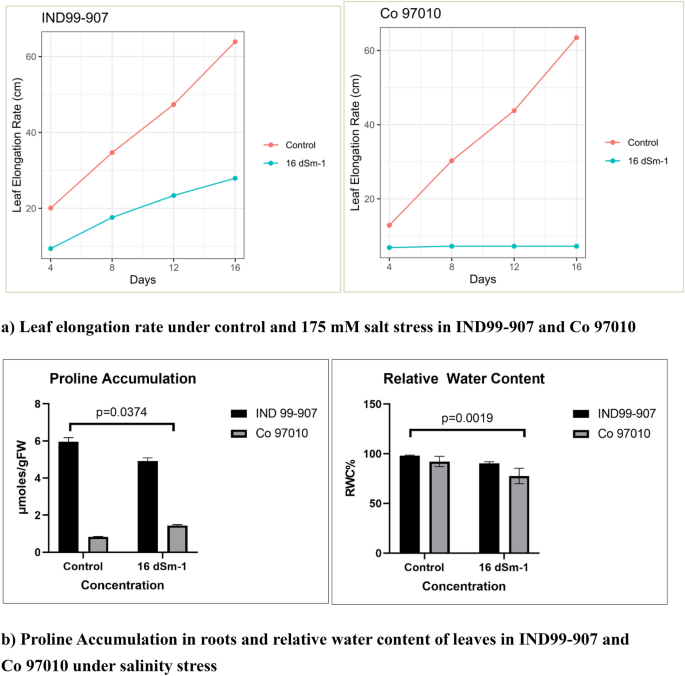
Sugarcane wild relative E. arundinaceus genotype IND99-907 was collected from the salinity affected area of Padiyattu Kadavu, Ernakulum, India under germplasm exploration programme during 1999 and adopted to high salinity stress with normal plant growth29 and a potential source for harnessing the salt stress-responsive genes. On the other hand, the sugarcane genotype Co 97010 is highly sensitive to salinity and has been used as a salt-sensitive standard in many studies30,31. The 90 days old plants of IND99-907 and Co 97010 were imposed with salinity stress by irrigating with 175 mM saline water. The leaf elongation rate (LER) was significantly higher in IND99-907 under salinity stress and growth was ceased in Co 97010 (p value = 0.0251) (Fig. 1a). The physiological assay for proline content in roots showed that IND99-907 recorded significantly higher proline content of 8.908 µmoles/gram of root samples as compared to 1.438 µmoles/gram in Co 97010 under salinity stress (p value = 0.0374) (Fig. 1b). The relative water content revealed that IND99-907 has retained the higher water content under the stressed condition as compared to Co 97010 (p value = 0.0019).
Figure 1 Phenotypic and physiological responses of IND99-907 and Co 97010 under salinity stress (A) Leaf elongation rate, (B) Proline content of roots and Relative water content in leaves. Error bars indicates the mean ± SD. Full size image
The root anatomical studies under light microscope revealed the clear differences in thickening of cells around the metaxylem in IND99-907 and Co 97010. The vacuolization of the cortex was observed in Co 97010 as compared to the normal cortex in IND99-907. The thickening of endodermis and deformed protoxylem vessels were observed in Co 97010 as compared to no significant change in IND99-907 (Fig. 2a). The same results were confirmed in Scanning Electron Microscope which showed cell-wall thickening in protoxylem and thickening with circular xylem vessels in Co 97010. IND99-907 revealed xylem vessels without a significant change in protoxylem and metaxylem (Fig. 2b). Similar changes in the root cellular structure under drought and salinity stress in the tolerant genotypes are attributed to be an adaptive mechanism of resistant genotypes32,33.
Figure 2 Root anatomical changes in responses of IND99-907 and Co 97010 under salinity stress (A) Root anatomical images showing the vacuolization of cortex and thickening of metaxylem vessels in Co 97010 as compared to no significant changes in IND99-907. (B) Scanning Electron Micrograph showing thickening of protoxylem with circular xylem vessels in Co 97010 as compared to irregular shaped xylem vessels in IND99-907 and, EDAX analysis showing elemental composition of roots under salinity stress. (a) Root anatomical characterization under controlled and stressed roots of Co 97010 and IND99-907. (b) Section Electron micrograph and EDAX under controlled and stressed roots of Co 97010 and IND99-907. Full size image
The elemental composition of stressed and control samples were analyzed by SEM- EDX and ICP-OES methods. The differential accumulation pattern of sodium, calcium, magnesium, and potassium under both control and stressed root samples were observed in IND99-907 and Co 97010. The lowest Na+/K+ ratio of 0.64 was observed in IND99-907 as compared to 1.50 in Co 97010 by ICP-OES analysis. A similar trend of lowest Na+/K+ was observed in IND99-907 (2.18) as compared to 7.64 by Co 97010 (Table 1 and Fig. 2b) in SEM–EDX analysis. Similarly, IND99-907 also recorded the lowest Ca2+/K+ (1.05) and Mg2+/K+ (0.23) ratio as compared to 4.52 and 0.73 in Co 97010 respectively under salinity stressed condition.
Table 1 Estimated Sodium–Potassium ratio by ICP-OES and SEM–EDX method at 175 mM for 15 days in pot culture experiment. Full size table
Transcriptome data overview
The comparative transcriptome analysis was performed between stressed and control samples of saline-tolerant E. arundinaceus accession IND99-907 and saline-sensitive sugarcane genotype Co 97010 with three biological replications. A total of 305, 244, 264, and 263 million raw reads were obtained from the stressed and control libraries of IND99-907 (marked as 907S and 907C) and Co 97010 (marked as 97010S and 97010C) respectively (Supplementary Table S1). The pre-processing of raw reads by removal of adapter sequences, rRNA sequences, and ambiguous bases with high-quality sequences with a Phred score of ≥ 30 (Q30) resulted in 226, 182, 196, and 198 million clean reads from stressed and control libraries of IND99-907 and Co 97010 respectively. We obtained more than 74% of the high-quality clean reads after pre-processing of the raw data resulting in 802 million clean reads which were good enough to perform the RNASeq analysis.
De novo assembly of transcripts and unigenes clustering
The high-quality reads of stressed and control libraries of IND99-907 and Co 97010 were assembled into four de novo assemblies for 907C, 907S, 97010C and 97010S using Trinity v2.8.5. The quality assessment and comparison of assemblies were performed using Quast and BUSCO tools34,35. (i) The Quast analysis revealed the total number of contigs of four assemblies ranging from 205,717 to 345,745, with the highest contig N 50 of 1727 bp observed in 907S assembly and the largest contig of 29,724 bp was recorded in 97010S assembly. (ii) BUSCO analysis showed the completeness percentage ranging from 69.8% (907C) to 80% (907S) with a maximum duplication of 42.1% was observed in 97010C assembly. After unigenes clustering, the number of contigs ranged from 179,304 to 242,390 with the highest contig N 50 of 2102 bp in 907S unigenes assembly. The merging of control and stressed unigene assemblies for each genotype resulted in the identification of 315,611 unigenes with a contig N 50 of 2071 bp and 426,820 unigenes with N 50 of 1800 bp in clustered unigene assembly of IND99-907 and Co 97010 respectively (Supplementary Table S1). The high quality clustered assemblies of IND99-907 and Co 97010 were used for transcript quantification and annotation processes.
Transcript abundance estimation and differential gene expression
The coding DNA sequences were identified from the clustered assemblies of IND99-907 and Co 97010 by using the TransDecoder tool and the transcript quantification was performed by using RSEM v1.2.25. The transcript counts generated by RSEM were used to perform the differential gene expression (DGE) analysis by using DESeq2 for both IND99-907 and Co 97010 separately. The DEGs were identified based on absolute log 2 FC > 2 for upregulated genes and log 2 FC < -2 for downregulated genes. A total of 7731 DEGs from IND99-907 (Control vs Stress) DEG library and 6159 DEGs from Co 97010 (Control vs Stress) library were obtained at significance level p < 0.05. The FDR corrections were performed through the Benjamini–Hochberg method36 to reduce the false positives and, a stringent FDR < 0.01 was used to further reduce the number of DEGs which yielded a total of 649 DEGs in IND99-907 and among them, 425 genes were upregulated and 197 were downregulated. A total of 501 DEGs (FDR<0.01) were identified in Co 97010 and out of them, 283 genes were upregulated and 213 genes were downregulated (Fig. 3). These DEGs (FDR<0.01) identified in IND 99-907 and Co 97010 were used for functional annotation.
Figure 3 Volcano plots displaying the distribution of DEGs between control vs stress conditions of (a) IND99-907 and (b) Co 97010 based on FDR < 0.01. Full size image
Functional mapping of DEGs
The functional annotation of DEGs (FDR < 0.01) of IND99-907 and Co 97010 were carried out by using tools such as Blast2GO, HMMer & Command-line Blast against NCBI-nr, Swissprot, Pfam, and Uniprot Plant databases. The results against the NCBI-nr database for total DEGs (FDR < 0.01) showed 88.4% and 90.6% annotations for IND99-907 and Co 97010 respectively. Gene Ontology (GO) annotations were obtained for all DEGs. Upregulated and downregulated genes were also annotated separately using Blast2GO for both IND99-907 and Co 97010. In IND99-907, 88.2% of the upregulated and 93.4% of the downregulated genes were blasted with hits respectively and for Co 97010, 91.2% of upregulated and 93.4% of downregulated genes had blast annotations. The top hit species of DEGs were Sorghum bicolor, Zea mays, Setaria italica, and Setaria viridis. A total of 81 DEGs in IND99-907 had fold change values (log 2 FC) greater than 20, which includes ATP synthase, abscisic stress ripening protein 2, E3 ubiquitin-protein ligase AIRP2, serine/threonine-protein kinase WNK1 and ABC Transporter F (Supplementary Table S2). In total, five stress-related proteins, nine heat-shock proteins (HSPs), 25 transporters, 46 kinases, and 37 transcription factors (TFs) were significantly differentially regulated (FDR 20 which included three hypothetical proteins, two ribosomal proteins, and two dehydrogenases. Three stress-related DEGs were identified in Co 97010, namely salt stress-induced hydrophobic peptide ESI3 (ESI3), heat stress transcription factor C-2a (HSFC2A) and abscisic stress ripening protein 2 (ASR2), out of which ESI3 and HSFC2A were upregulated and ASR2 was downregulated under stress conditions. Further, a total of six heat shock proteins, 18 transporters, 18 kinases, and 19 TFs were identified in Co 97010. Gene families were identified for both DEGs of IND99-907 and Co 97010, which showed 413 gene families present in 649 DEGs of IND 99-907 and 327 gene families present in 501 DEGs of Co 97010.
Gene ontology (GO) enrichment
Gene Ontology (GO) annotations for DEGs were categorized into three GO functional classifications as cellular component (CC), molecular function (MF) and biological process (BP)37. A total of 78.7% hits in IND99-907 and 78.2% in Co 97010 were mapped using GO analysis. GO enrichment analysis showed significant enrichment (FDR < 0.05) of 17 different processes for 649 DEGs in IND99-907. The significantly enriched stress-related processes (FDR < 0.05) were given in Supplementary Table S3, S4 & Supplementary Figure S1A. Similarly, the GO enrichment of MF and CC were also studied to identify the significant enrichments at FDR ≤ 0.05 correspondingly which showed two molecular functions namely transporter (GO:0005215) and transferase (GO:0016740) activity (Supplementary Table S3 & Supplementary Figure S1B) and one cellular component namely vacuole (GO:0005773) (Supplementary Figure S1C) under salinity stress in IND99-907. Whereas in Co 97010, two biological processes namely metabolite and energy precursor generation (GO:0006091) and response to stress (GO:0006950) were significantly enriched among 501 DEGs at FDR ≤ 0.05 (Supplementary Table S4) and no significant enrichment at FDR ≤ 0.05 was observed for cellular components and molecular functions.
KEGG annotation and enrichment
KEGG annotations and Enzyme Code (EC) mapping were performed using Blast2GO. A total of 79 different KEGG pathway hits were obtained for 649 DEGs in IND99-907 and 67 KEGG pathway hits were obtained for 501 DEGs in Co 97010 with both of them having major hits in Glycolysis/Gluconeogenesis (ko00010), Pyruvate metabolism (ko00620), Galactose metabolism (ko00052) and Starch and Sucrose metabolism (ko00500). Further, KEGG enrichment showed a total of 27 statistically significant (FDR < 0.05) enriched KEGG pathways in IND99-907 (Supplementary Table S5) including Endocytosis (ko04144), Lysine degradation (ko00310), Plant hormone signal transduction (ko04075), Oxidative phosphorylation (ko00190) and MAPK signalling pathway (ko04016). In contrast, DEGs of Co 97010 showed 20 significantly enriched KEGG pathways (FDR < 0.05) (Supplementary Table S6) such as Oxidative phosphorylation (ko00190), Metabolic pathways (ko01100), and Photosynthesis (ko00195).
Endocytosis
Endocytosis, an important pathway for the intracellular vesicle trafficking system was significantly enriched (FDR = 3.18E-09) in total DEGs of IND99-907 under salinity stress. A total of nineteen transcripts were differentially regulated and among them, seven were upregulated and twelve were downregulated. Among the upregulated gene hits in the pathway, clathrin interactor epsin-2 showed the highest upregulation (log 2 FC = 20.31). Other genes and their fold change values were ras-related RabE1d protein (log 2 FC = 8.77), ArfGAP (log 2 FC = 7.72), phospholipase D (log 2 FC = 7.990 and HSP70 (log 2 FC = 3.49). It was observed that the same pathway was significantly enriched (FDR = 0.001157) in the DEGs Co 97010 with two of the proteins ADP-ribosylation factor 1 (log 2 FC = − 9.21) and vacuolar protein sorting associated protein (log 2 FC = − 3.49) being highly downregulated under salinity stress (Supplementary Figure S2).
Oxidative phosphorylation
Oxidative phosphorylation is a pathway associated with the formation of ATP through phosphorylation of NADH or FADH 2 by electron transport chain. This pathway was significantly enriched at FDR = 0.005099 in DEGs of IND 99-907 with a total of nine transcripts involving in the pathway. The highest upregulation was observed in the protein ATP synthase (log 2 FC = 22.66) which catalyses the formation of ATP. Several ATPase hits were observed in the pathway like calcium-transporting, plasma membrane, V-type proton ATPases and the highest upregulated was observed in ATPase subunit 6 (log 2 FC = 21.09). The same pathway was also significantly enriched (FDR = 7.45E−16) in the DEGs of Co 97010 with a total of twenty transcripts involving in the pathway including dehydrogenase, cytochrome c oxidase, and ATP synthase. The highest down regulation was observed in cytochrome c oxidase (COX) (log2FC = − 26.86) followed by ATP synthase CF1 beta subunit (log2FC = − 25.00) (Supplementary Figure S3).
qRT-PCR validation of transcriptome data
A total of 43 DEGs representing the various metabolic pathways in both IND 99-907 and Co 97010 were chosen for qRT-PCR validation. The details of the genes selected for validation and their primers are given in Table 2. Dehydrin DHNs are a group of LEA proteins involved in membrane stabilization during abiotic stresses38 was upregulated in both IND99-907 and Co 97010 and the same was reconfirmed in qRT-PCR. NADH dependent malic enzyme upregulated in response to abscisic acid signalling and drought39 was upregulated in IND99-907 and downregulated in Co 97010. Dirigent-like protein associated with lignin biosynthesis and cellular stabilization40 was upregulated in IND99-907 and nil expression was observed in Co 97010. Katanin is a microtubule41 and its regulating gene Katanin p80 WD40 repeat was upregulated in IND99-907 and nil expression was observed in Co 97010. Total of 43 genes were validated using qRT-PCR and correlation of 0.53 was observed between RNAseq and quantitative gene expression by qRT-PCR.
https://www.nature.com/articles/s41598-021-03735-5