Sputum microbiota profiles of treatment-naïve TB patients in Uganda before and during first-line therapy David Patrick Kateete1 na1, Monica M. Mbabazi1, Faith Nakazzi1, Fred A. Katabazi1, Edgar Kigozi1, Willy Ssengooba2, Lydia Nakiyingi3,4, Sharon Namiiro5, Alphonse Okwera6, Moses L. Joloba1 & Adrian Muwonge7,8 na1 Scientific Reports 11, Article number: 24486 (2021) Cite this article DiseasesMedical researchMicrobiologyMolecular biology Information on microbiota dynamics in pulmonary tuberculosis (TB) in Africa is scarce. Here, we sequenced sputa from 120 treatment-naïve TB patients in Uganda, and investigated changes in microbiota of 30 patients with treatment-response follow-up samples. Overall, HIV-status and anti-TB treatment were associated with microbial structural and abundance changes. The predominant phyla were Bacteroidetes, Firmicutes, Proteobacteria, Fusobacteria and Actinobacteria, accounting for nearly 95% of the sputum microbiota composition; the predominant genera across time were Prevotella, Streptococcus, Veillonella, Haemophilus, Neisseria, Alloprevotella, Porphyromonas, Fusobacterium, Gemella, and Rothia. Treatment-response follow-up at month 2 was characterized by a reduction in abundance of Mycobacterium and Fretibacterium, and an increase in Ruminococcus and Peptococcus; month 5 was characterized by a reduction in Tannerella and Fusobacterium, and an increase in members of the family Neisseriaceae. The microbiota core comprised of 44 genera that were stable during treatment. Hierarchical clustering of this core’s abundance distinctly separated baseline (month 0) samples from treatment follow-up samples (months 2/5). We also observed a reduction in microbial diversity with 9.1% (CI 6–14%) of the structural variation attributed to HIV-status and anti-TB treatment. Our findings show discernible microbiota signals associated with treatment with potential to inform anti-TB treatment response monitoring. Tuberculosis (TB) is a persistent global public health problem and one of the top 10 causes of death worldwide1,2. Nearly half a million new TB cases have been reported in Uganda since 20101, and the TB incidence in the country has surpassed that of HIV-infection3. While introduction of the Xpert MTB/RIF assay revolutionized the diagnosis of TB globally4, treatment still hinges on long treatment regimens i.e., 6–24 months depending on whether treating drug susceptible TB or drug resistant TB5. The standard first-line treatment regimen comprises of an intensive phase of 2 months treatment with isoniazid, rifampicin, pyrazinamide and ethambutol, followed by a continuation phase of 4 months treatment with isoniazid and rifampicin6,7. Following commencement of treatment with anti-TB drugs, sputum microscopy for identification of mycobacteria (in form of acid-fast bacilli, AFB) or where affordable, sputum culturing for Mycobacterium tuberculosis growth is done during the treatment period, usually at months 2 and 5 to monitor treatment response. Attaining sputum sterilisation, also known as sputum smear-conversion or sputum culture-conversion (i.e., from AFB smear/culture-positive to AFB smear/culture-negative) at months 2 or 5 after initiating treatment is a known cardinal index of treatment success. In this regard, the World Health Organization (WHO) guidelines state that ‘a patient whose sputum was AFB smear-positive or culture-positive at the beginning of treatment but becomes smear-negative or culture-negative in the last month of treatment and on at least one previous occasion is declared cured’ of TB6,8. Despite the importance of sputum-smear/sputum-culture conversion in monitoring TB treatment response9, they have low sensitivity and in sub-Saharan Africa culturing is mainly done in reference/regional laboratories but not as routine. Therefore, identification of microbiological factors in a sputum sample, the cornerstone for diagnosing TB, and their association with anti-TB treatment response, could be useful in unravelling new approaches for improving treatment response monitoring7.
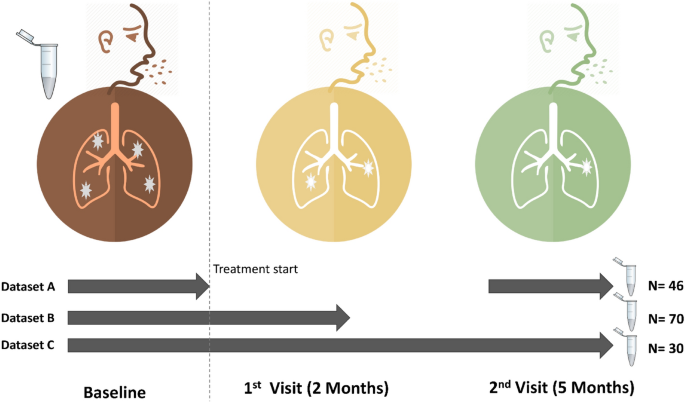
The microbiota are microorganisms—bacteria, fungi, protozoa and viruses that live on the skin and mucosa of humans and other mammals. Their role in induction, maintenance, disruption and modulation of the immune response has recently come into focus with the advent of the human microbiome project10. The microbiota also exist in the lung11, the predilection site for M. tuberculosis and perhaps influence its behaviour in a variety of ways—for example via signalling11,12,13, which could lead to positive interactions (synergism) and/or negative interactions (competition)14. Therefore, a sound understanding of the microbiota dynamics in TB is necessary given their emerging importance in human and animal health11,15. In this context, microbial profiling in TB could advance our knowledge of TB pathogenesis (infection vs. active disease) or unravel new ways in which TB diagnostics and management can be improved7,11,12,13. Although microbiota shifts have been associated with several conditions and infectious diseases including pulmonary TB11,12,16,17, there is a general lack of knowledge on microbiota and disease in sub-Saharan Africa11 where there is high burden of both TB and HIV.18 For the first time, we report the sputum microbial composition of treatment-naïve TB patients in Uganda, and the impact of first-line anti-TB drugs on the microbiota using sputum as proxy for the lung environment19. As well, we describe the microbial changes associated with critical transitions of anti-TB treatment: pre-treatment (baseline) and treatment response follow-up at months 2 and 5.We enrolled 120 treatment-naïve TB patients at Mulago National Referral Hospital (Mulago hospital) in Kampala, Uganda, in the period between 2016 and 2018. Table 1 summarises the clinical and demographic characteristics of the patients; the mean age was 33 years—majority were male and residents of greater Kampala metropolitan area (i.e., Kampala city proper and the neighbouring districts of Wakiso, Mukono, Mpigi, Buikwe and Luweero), Supplementary Fig. S1 online.Table 1 Clinical and demographic characteristics of pulmonary TB patients enrolled.Taxonomic composition of the sputum microbiotaHigh-throughput sequencing of the variable region of the 16S rRNA gene generated a total of 9,316,821 sequence reads from the 205 sputum samples i.e., 120 (baseline), 44 (month 2), and 41 (month 5). After filtering and quality control, we retained 8,638,640 sequences representing 191 samples—106 (baseline), 44 (month 2), and 41 (month 5) that were analysed; 14 baseline samples were removed due to poor sequence quality, Table 1. The retained high-quality sequences yielded 8,180 operational taxonomic units (OTUs), 18 phyla and 333 genera.Figure 1 shows the sputum samples collected from patients at baseline (i.e., month 0 prior to anti-TB treatment commencement) and treatment response follow-up visits (months 2 and 5). Of the 106 patients enrolled, 30 had samples across the three-sampling points – Fig. 1, dataset C; 70 had samples at baseline and month 2 (dataset B), 46 had samples at baseline and month 5 (dataset A)—the microbial analyses reported in this study focus on dataset C to allow for within and between patient comparison of microbiota changes. However, to fully explore the breadth and depth of microbial characteristics for TB patients, we explored the entire dataset (Fig. 1) and show that a sputum sample on average generated 44,992 sequences, 6,580 OTUs, 4 phyla and 36 genera (also see Supplementary Figs. S2, S3 and S4). The predominant phyla detected were Bacteroidetes, Firmicutes, Proteobacteria, Fusobacteria and Actinobacteria, accounting for nearly 95% of the sputum microbiota composition.Figure 1Participants’ enrolment, sampling and treatment response follow-up at months 2 and 5. A total of 120 pulmonary TB patients were enrolled at month 0 (baseline) prior to treatment commencement with first-line anti-TB drugs; of these, 70 had sputum samples at months 0 and 2 (dataset B), 46 had samples at months 0 and 5 (dataset A), while 30 had samples at months 0, 2 and month 5 (dataset C). The microbiome analyses reported in this study focus on dataset C. Dark red, orange and green icons depict months 0, 2 and 5, respectively.While we observed similar microbial composition at phylum level in the sputa of 30 patients with samples across the three-sampling points, the composition of the bacterial genera in treatment follow-up samples varied compared to baseline samples, Fig. 2. We observed a dramatic reduction in number of sequences mapping to the genus Mycobacterium at month 2, probably due to the effect of anti-TB drugs. Overall, 10 major genera—Prevotella, Streptococcus, Veillonella, Haemophilus, Neisseria, Alloprevotella, Porphyromonas, Fusobacterium, Gemella and Rothia, were detected across the sampling period. Megasphaera was detected only at baseline (month 0); Stomatobaculum was absent at baseline but occurred at months 2 and 5. Furthermore, Leptotrichia and Actinobacillus were present at baseline and month 2 but undetected at month 5, while Oribacterium and Johnsonnella exclusively occurred at month 5, Fig. 2. Overall, 617 OTUs and 91 genera were shared between patients across the three-sampling points. The changes in abundance of some of the dominant genera i.e., Megasphaera, Stomatobaculum, Leptotrichia and Johnsonnella could represent microbial shifts worth exploiting to improve monitoring of TB treatment in the future.Figure 2The 15 major bacterial genera detected across the three-sampling points.Although sputum microbial characteristics of pulmonary TB patients have been explored before11,17,20,21, for the first time we report on this from a country where HIV-associated TB is prevalent1,22 and ranked by the WHO alongside 29 other countries as having the highest burden of TB globally1. Overall, our study generated nearly 16 times the number of OTUs reported in Asia16,17, probably due to differences in amplicon sequencing technology used i.e., MiSeq/illumina sequencing platform vs. 456/pyrosequencing in previous studies. Equally, these differences may signify a higher sputum microbiota diversity for Ugandan TB patients: indeed, the microbiota diversity observed in this study accounts for nearly 48% of the diversity in the human oral microbiome database http://www.homd.org. Generally, the sputum microbiota composition of pulmonary TB patients has been previously described as complex and more diverse than that of healthy control participants23, and our report seems to conform to this trend i.e., the sputum microbiota of TB patients in Uganda appears as complex and diverse as reported for TB patients in Asia16,17,23,24. For example, there was an average of 6580 OTUs and 36 genera in a sputum sample in this study vs. 602 OTUs and 12 genera in a sputum sample in India17. Although at high taxonomic level (i.e., phylum) the microbiota profile of TB patients in Uganda is comparable to the one reported in previous studies (e.g., the five major taxa described in this study—Actinobacteria, Bacteroidetes, Firmicutes, Fusobacteria and Proteobacteria, were previously reported as major phyla in Asia comprising of ≥ 98% of the sputum microbiota composition of pulmonary TB patients16,17,23), genus level analysis reveals considerable differences in diversity and distribution of the major genera detected in Ugandan vs. Asian TB patients16,17,23,24 i.e., Prevotella, Streptococcus, Veillonella, Haemophilus, Neisseria, Alloprevotella, Porphyromonas, Fusobacterium, Gemella, Rothia, Leptotrichia, Megasphaera, Stomatobaculum, Oribacterium, and Johnsonella. Prevotella, Streptococcus and Veillonella are the three most prevalent genera in this study, which is in agreement with the findings of a previous study in China16; however in India, one study reported Streptococcus, Neisseria and Veillonella as the three most prevalent genera17. Of note, Prevotella is consistently reported as a major component of sputum microbiota in chronic obstructive pulmonary disease (COPD), cystic fibrosis, pulmonary TB and lower respiratory tract infections16,23. Furthermore, while genera like Leuconostoc, Lactobacillus, Corynebacterium, Bacillus, Acinetobacter, Granulicatella, Actinomyces, Anoxybacillus, Klebsiella, Pilibacter, Abiotrophia, Paucisalibacillus, Stenotrophomonas, Cupriavidus, Pseudomonas, Thermus, Sphingomonas, Brevundimonas, Brevibacillus, Methylobacterium, Diaphorobacter, Comamonas, Mobilicoccus, Gramulicatella and Fervidicoccus were described as prevalent and abundant in pulmonary TB patients in India17 and/or China23,24, they are not among the 15 major genera reported in our study. These differences likely represent inherent environmental characteristics between the two geographic locations; the granular role on TB treatment outcomes is beyond the scope of this study but merits further study.A comparison of amplicon sequencing and conventional TB diagnosticsIn this study, there was a 0.61 (CI 0.50–0.71) and 0.63 (CI 0.51–0.73) agreement between the detection of Mycobacterium sequences and positive outcome on microscopy and culture (Löwenstein-Jensen—LJ), respectively. In other words, detection of Mycobacterium sequences in a microbiome dataset correlated with sputum-smear positivity and/or sputum-culture positivity; a Kappa test for agreement showed a 61% agreement between amplicon sequencing and microscopy, and a 63% agreement between amplicon sequencing and culture. However, this potential diagnostic utility i.e., high positive predictive value of 0.71 (CI 0.59–0.81) and 0.75 (CI 0.63–0.91) respectively, is eroded by poor specificity (see Supplementary Table S1 and Supplementary Fig. S2 online). Therefore, while amplicon sequencing ably identified smear-positive and/or culture-positive TB patients, its performance with smear-negative and/or culture-negative TB samples was poor. Furthermore, while amplicon sequencing is 10 times more expensive than microscopy (e.g., the cost for amplicon sequencing is $25 [US dollars] per sample vs. ≤ $2.5 per sample for microscopy), it is considerably less expensive than culture (e.g., the cost for TB culture in resource-limited settings is on average $62.1 per sample25). Therefore, amplicon sequencing could be a good diagnostic alternative in resource-poor settings where culture is very expensive.We also note that smear-negative and culture-negative samples produced comparatively more sequence reads than the smear-positive and culture-positive samples (see Supplementary Table S
https://www.nature.com/articles/s41598-021-04271-y