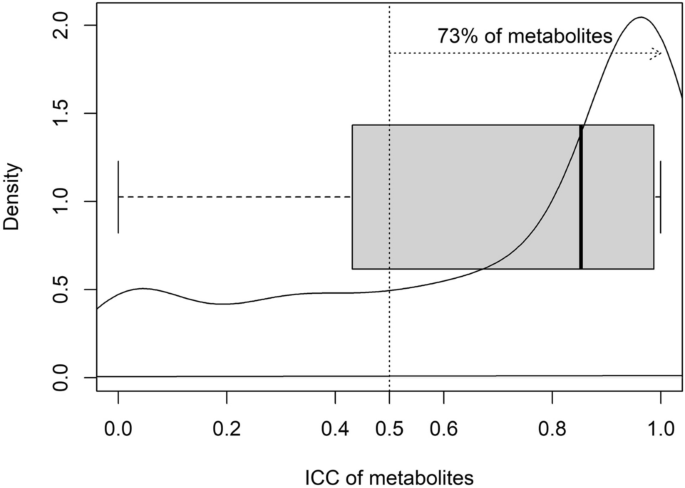
Variability of human fasted venous plasma metabolomic profiles with tourniquet induced hemostasis Venous plasma metabolomics is a potent and highly sensitive tool for identifying and measuring metabolites of interest in human health and disease. Accurate and reproducible insights from such metabolomic studies require extreme care in removing preanalytical confounders; one of these is the duration of tourniquet application when drawing the venous blood sample. Using an untargeted plasma metabolomics approach, we evaluated the effect of varying durations of tourniquet application on the variability in plasma metabolite concentrations in five healthy female subjects. Tourniquet application introduced appreciable variation in the metabolite abundances: 73% of the identified metabolites had higher temporal variation compared to interindividual variation [Intra-Class Correlation (ICC) > 0.50]. As such, we recommend tourniquet application for minimal duration and to wait for 5 min with the needle in situ after removing the tourniquet, to reduce hemostasis-induced variability and false flags in interpretation. Metabolomics, or the identification and measurement of metabolites in biological samples, has become an invaluable means for generating new knowledge in terms of markers for prognosis and diagnosis of human pathophysiology as well as of new leads in understanding causal pathways1,2,3,4. Of the various possible sources of samples from human subjects for metabolomic assessments, components of blood (plasma and serum), remain the most relevant and therefore, most studied type of sample5. However, unlike metabolomics performed with samples generated from in vitro or animal model experiments that are inherently less heterogenous, using plasma or serum metabolomics as a tool in human translational research is subject to the inherent interindividual variability between subjects due to genetic and environmental factors and their interactions. An additional source of variation is pre-analytic factors. Controlling for such variability introducing pre-analytic factors would be key to improving reproducibility of high impact human metabolomic findings such as the use of sarcosine as a biomarker for progression of prostate cancer6,7. Here, fasting status, type of collection tube, presence of haemolysis, time taken and temperature of sample during processing, temperature and duration of storage of processed samples, and freeze–thaw cycles have been assessed8,9,10,11,12. Unknown and unaccounted for variation arising due to pre-analytic factors could lead to overestimation of interindividual variation or even intraindividual variation, if the samples have been collected at multiple time points in a longitudinal fashion. However, Agueusop et al.13 reported remarkable stability of the human serum metabolome over a 4 weeks’ time period, when the samples were collected on 3 different days under stringently controlled conditions.An additional, unstudied and potentially significant variation might arise from local tissue hemostasis during venous blood collection due to variable tourniquet application times and associated haemostasis. We could not identify any study that has investigated this effect on metabolomic readouts in the plasma. Therefore, we explored the effect of different durations of tourniquet-induced local hemostasis on fasted venous plasma metabolomic profiles of South Asian Indian women, for a deeper understanding of tourniquet-time related precautions required for reproducible untargeted human metabolomic studies. Our hypothesis was that the number of metabolites differing in abundance from the control, unrestricted blood flow condition would increase in step with the increased time of tourniquet-induced local hemostasis.Socio-demographic characteristics, anthropometric measurements and metabolic profiles of the study participants are summarized in Table 1. All 05 subjects were apparently healthy, pre-menopausal females (age range 26.7–33.3 years). The BMI of the subjects ranged from normal to overweight (21.6–27.3 kg/m2). The subjects were normoglycemic (mean fasting glucose: 88.2 ± 5.2 mg/dL) and normotensive [mean systolic blood pressure and diastolic blood pressure (mmHg): 107.4 ± 5.8 and 84.2 ± 7.4 respectively].Table 1 Subject characteristics and metabolic profile of the 05 study subjects.A total of 353 metabolites were identified in the study plasma samples by the Compound Discoverer software (version 3.1.0.305, ThermoFisher Scientific, Vanquish Flex Binary, Waltham, MA, USA). Since our primary aim was to identify and quantitate the variation, if any, in the relative abundance of plasma metabolite across the 4 collection time points in all the study participants, we decomposed total variability into within time point variation (inter-individual variation) and between time point variation (temporal variation) (Supplementary Table 1). The temporal variation in the relative abundance of the identified metabolites between the 4 plasma collection time points, i.e., 1, 2 and 4 min after tying the tourniquet (T1, T2, T4 respectively) and free flowing blood with no tourniquet (NT, which was the collection made 5 min after the removal of the tourniquet,) in 5 study participants is summarized in Fig. 1. In this, 73% of the identified metabolites had higher temporal variation compared to interindividual variation, as evident from Intra-Class Correlation (ICC) > 0.50, ICC being the proportion of temporal variation over total (temporal + inter-individual) variation. Interestingly, among all identified metabolites, 24 metabolites did not exhibit any temporal variation. The inter-individual variation for these 24 metabolites ranged between 11.4 to 98.1% (Supplementary Table 1). Box plots representing pareto-scaled intensities of three of these metabolites (pro-pro-pro, l-Isoleucine and l-Glutamic acid) and of three selected metabolites with high between timepoint temporal variability (1-Linoleoyl-sn-glycero-3-phosphocholine, 1-Oleoyl-sn-glycero-3-phosphocholine and 1-Palmitoyl-sn-glycero-3-phosphocholine) is presented in Fig. 2. The raw and Pareto-scaled intensities of the 353 metabolites for all study subjects and sample collection time points is available in Supplementary Tables 2 and 3 respectively.Figure 1Distribution of temporal variability, measured by Intra-Class Correlation (ICC) of the 353 metabolites, identified as differentially abundant between the 4 collection time points [T1, T2, T4: 1, 2 and 4 min, respectively, after tying the tourniquet and NT (no tourniquet with sample collection 5 min after removal of the tourniquet)] in 05 study participants. The bold dark vertical line of the box-whisker plot superimposed on the density indicates the median ICC, the left and right sides of the rectangle are indicative of 25th and 75th percentiles and the whiskers measure the 95% confidence interval. The vertical dotted line at 0.50 ICC has been included to visualize the proportion of metabolites accounting for temporal variability > 50% of total variation of each metabolite.Figure 2Box-whisker plots representing pareto-scaled intensities of selected High- and Low-Between Timepoint Variability Metabolites (HBTVM and LBTVM, respectively). (a) HBTVM1: 1-Linoleoyl-sn-glycero-3-phosphocholine, HBTVM2: 1-Oleoyl-sn-glycero-3-phosphocholine, HBTVM3: 1-Palmitoyl-sn-glycero-3-phosphocholine. (b) LBTVM1: pro-pro-pro, LBTVM2: l-Isoleucine, LBTVM3: l-Glutamic acid. The bold dark vertical line of the box-whisker plot indicates the median CV, the top and bottom ends of the rectangle are indicative of 25th and 75th percentiles and the whiskers measure the 95% confidence interval.In order to further understand the effect of tourniquet-induced haemostasis on variability in metabolite abundances, we derived the interindividual variability of each metabolite at the 4 collection time points by coefficient variation (CV) calculated as the ratio of median absolute deviation (MAD) about median to median of the raw abundance of respective metabolites (Fig. 3). The CVs ranged up to 100% and when evaluated at each collection time point, the median CV was least at NT (15.11%, Table 2).Figure 3The coefficient variation (CV) (representing inter-individual variability) of each metabolite at four sample collection time points [T1, T2, T4: 1, 2 and 4 min, respectively, after tying the tourniquet and NT (no tourniquet with collection 5 min after removal of the tourniquet)] in 05 study participants. The CVs were calculated as the ratio of median absolute deviation about median to median of the unscaled abundance (peak intensities) of respective metabolites and plotted for all 353 metabolites, identified as differentially abundant between the 4 collection time points (a) and as box-whisker plot (b) for each of the 4 collection time points summarizing the same feature by more interpretable manner. The bold dark horizontal line of the box-whisker plot indicates the median CV, the top and bottom ends of the rectangle are indicative of 25th and 75th percentiles and the whiskers measure the 95% confidence interval.Table 2 Distribution of interindividual variability of metabolite abundance of the 353 metabolites, measured as the Coefficient of Variations (CVs) by collection time points [T1, T2, T4: 1, 2 and 4 min, respectively, after tying the tourniquet and NT (no tourniquet with collection 5 min after removal of the tourniquet)] in 05 study participants. The CVs were calculated as the ratio of median absolute deviation about median to median of the unscaled abundance (peak intensities) of respective metabolites.Obtaining accurate and reproducible insights when using metabolomics tools in clinical research requires a critical evaluation of technical factors contributing to the overall variability of metabolomics profiles. We systematically interrogated the effect of duration of application of a tourniquet during collection of blood from healthy subjects, on the variability in metabolite concentrations using an untargeted metabolomics approach. We observed considerable temporal variability in relative abundance of the identified metabolites. The intra-class correlations, that measured the temporal variability in relation to the overall variability, were more than 0.50 for 73% of the identified metabolites (Fig. 1) and the mode was at ~ 0.90. Therefore, the duration of tourniquet application is an important factor that induces variability in measurement of abundance of the metabolites.The inter-individual variation in metabolite abundances was higher amongst the metabolites with least temporal variation compared to those with highest temporal variation. This is plausible in light of the observation that amongst the 24 metabolites without any temporal variation were sesamex (a synergist for insecticides)14, valdecoxib (a non-steroidal anti-inflammatory drug)15 and vanillin (primary component of vanilla bean extract)16. These are exogenous metabolites, whose presence in the plasma is likely indicative of an individual’s consumption/exposure to the relevant exogenous sources.With regard to time point of blood collection to minimize introducing variation due to tying of the tourniquet, the ideal situation would be to not use the tourniquet at all. However, considering the need for using the tourniquet to find the vein for blood collection in group of subjects where finding the vein is otherwise difficult, the duration of tourniquet application should be minimal and one should wait for 5 min with the needle in situ after removing the tourniquet, before blood sampling. As a rule, the shorter the duration of application of torniquet, the better the accuracy in the measurement of metabolites.A strength of our study is that we minimized inter-individual variation in plasma metabolomic profiles by carefully including subjects as similar to each other as possible, in terms of age (range 26.7–33.3 years), sex (all pre-menopausal females), ethnicity (South Asian Indian) and geographical location (Bangalore, India), as well as by collecting all samples within a one-hour time period in the morning, after a pre-defined fasting time period (11–12 h) These factors have been earlier reported to contribute to variability in human blood (plasma/serum) metabolomic profiles (age17,18,19,20, sex19,20, geographical location21,22,23, fasting/mealtime24 and time of day when sample is collected24). The small number of participants, with blood sampling at relatively few discrete time points, are limitations.To conclude, for untargeted human plasma metabolomics studies, we recommend that blood should be collected without the application of a tourniquet for needle insertion. If this is needed, for example, when finding a vein is difficult, blood should be collected within 1 min of applying the tourniquet; if not, blood should be collected from the in situ needle at least 5 min after removing the tourniquet. With common sense, we also recommend making other a priori decisions on the exact standard operating procedure for the subject’s fasting/fed state, duration of fasting, timing of the day for collection of sample, type of sample collection tubes, duration of tourniquet application during sample collection, time–temperature-duration of storing the samples before processing, steps of sample processing including sample aliquot sizes to minimize freeze–thaw cycles, time–temperature-duration of storing the samples after processing and before freezing, duration of sample storage under frozen condition, number of permissible freeze–thaw cycles and also of the steps for sample processing after thawing, for metabolomics analysis, at the start of a study. A uniform, practical and rigid standard operating procedure that addresses these variability-inducing factors is a prerequisite for improving reproducibility and therefore, the relevance of plasma or serum metabolomics as a tool for interrogating human health and disease.Apparently healthy female subjects (18–60 year old) volunteering to participate in the study were recruited at the Division of Nutrition, St. John’s Research Institute, St. John’s Medical College and Hospital, Bangalore. Exclusion criteria were: age outside 18–60 years range, not willing to participate in the study, were participating in other studies, had tested positive for hepatitis (HBsAg) or HIV, needed chronic or daily medical therapy (connective tissue diseases, inflammatory bowel disease, active tuberculosis, symptomatic heart disease), had serious pre-existing
https://www.nature.com/articles/s41598-021-03665-2
Variability of human fasted venous plasma metabolomic profiles with tourniquet induced hemostasis