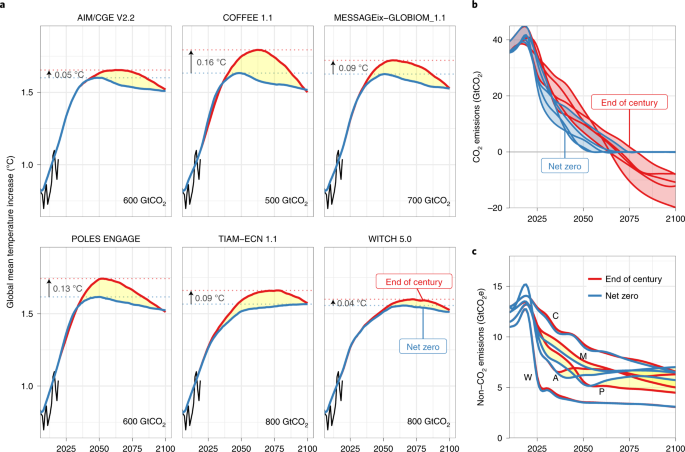
Net zero-emission pathways reduce the physical and economic risks of climate change Laurent Drouet orcid.org/0000-0002-4087-76621, Valentina Bosetti orcid.org/0000-0003-4970-00271,2, Simone A. Padoan3, Lara Aleluia Reis orcid.org/0000-0002-6676-70071, Christoph Bertram orcid.org/0000-0002-0933-43954, Francesco Dalla Longa orcid.org/0000-0001-6390-98425, Jacques Després orcid.org/0000-0002-9851-99646, Johannes Emmerling orcid.org/0000-0003-0916-99131, Florian Fosse orcid.org/0000-0002-0239-11436, Kostas Fragkiadakis orcid.org/0000-0002-1129-03607, Stefan Frank orcid.org/0000-0001-5702-85478, Oliver Fricko orcid.org/0000-0002-6835-98838, Shinichiro Fujimori orcid.org/0000-0001-7897-17968,9,10, Mathijs Harmsen orcid.org/0000-0001-6755-156911,12, Volker Krey orcid.org/0000-0003-0307-35158, Ken Oshiro orcid.org/0000-0001-6720-409X9, Larissa P. Nogueira orcid.org/0000-0003-3156-59985, Leonidas Paroussos orcid.org/0000-0001-8251-72707, Franziska Piontek orcid.org/0000-0003-4305-75524, Keywan Riahi orcid.org/0000-0001-7193-34988,13, Pedro R. R. Rochedo orcid.org/0000-0001-5151-089314, Roberto Schaeffer orcid.org/0000-0002-3709-732314, Jun’ya Takakura orcid.org/0000-0002-6184-842210, Kaj-Ivar van der Wijst orcid.org/0000-0002-9588-705911,12, Bob van der Zwaan orcid.org/0000-0001-5871-76435,15,16, Detlef van Vuuren orcid.org/0000-0003-0398-283111,12, Zoi Vrontisi orcid.org/0000-0003-3767-06177, Matthias Weitzel orcid.org/0000-0003-3764-37316, Behnam Zakeri orcid.org/0000-0001-9647-28788 & Massimo Tavoni orcid.org/0000-0001-5069-47071,17 Nature Climate Change 11, 1070–1076 (2021)Cite this article 4134 Accesses 1 Citations 131 Altmetric Metrics Climate-change impactsClimate-change mitigationClimate-change policy Mitigation pathways exploring end-of-century temperature targets often entail temperature overshoot. Little is known about the additional climate risks generated by overshooting temperature. Here we assessed the benefits of limiting overshoot. We computed the probabilistic impacts for different warming targets and overshoot levels on the basis of an ensemble of integrated assessment models. We explored both physical and macroeconomic impacts, including persistent and non-persistent climate impacts. We found that temperature overshooting affects the likelihood of many critical physical impacts, such as those associated with heat extremes. Limiting overshoot reduces risk in the right tail of the distribution, in particular for low-temperature targets where larger overshoots arise as a way to lower short-term mitigation costs. We also showed how, after mid-century, overshoot leads to both higher mitigation costs and economic losses from the additional impacts. The study highlights the need to include climate risk analysis in low-carbon pathways. Multiple mitigation trajectories are consistent with climate stabilization1, which may lead to different climate change risks2,3. One important feature of the pathways is the extent to which temperature is allowed to temporarily exceed a given target, commonly known as ‘overshoot’. Given historical emissions, stringent long-term temperature targets, such as limiting the temperature increase to 1.5 °C in 2100, often entail temporary temperature exceedance to be compensated by net negative carbon emissions in the second half of the century4. These pathways are the outcome of Integrated Assessment Models (IAMs) constrained to meet fixed-year targets, often for 21005,6,7. The extent of overshoot is a function of many variables defining how rapidly human systems can be transformed, including socioeconomic and technological progress variables. For example, the assumptions of bioenergy technologies with carbon dioxide capture and geologic storage vary substantially across models8. It is also rooted in the choice of normative parameters. For example, time discounting consistent with proper consideration of future generations reduces overshoot and reliance on carbon dioxide removal9. Finally, the overshoot might depend on the way scenarios are designed and executed10. To overcome some of the limitations of end-of-century target scenarios, a scenario design has been recently proposed. It caps the peak temperature reached during the century, limiting ‘net zero’ carbon emissions11.One reason for the temperature overshoot is that, usually, cost-minimizing emission pathways don’t account for the climate benefits associated with different temperature trajectories. Detailed process IAMs, such as those providing input to the IPCC12, are tools primarily designed for mitigation analysis. As such, they don’t take into account that overshoot trajectories lead to worse heat extremes than no-overshoot trajectories13. Benefit–cost IAMs include climate impacts, but lack mitigation strategy details and focus solely on monetary impacts14. Thus, their capacity to evaluate the full trade-offs implied by different intertemporal mitigation trajectories compliant with given climate stabilization targets is limited. Still, recent benefit–cost studies have highlighted the economic inequality repercussions in low-temperature cases15. Here we combined mitigation pathways with a postprocessing analysis of both physical and economic climate impacts, employing advanced statistical approaches. We used a large set of scenarios generated by a multimodel ensemble of nine leading detailed process IAMs, which explore end-of-century budget scenarios (where overshoot is allowed) versus net zero emission constrained budget scenarios. The pairwise comparison highlights the overshoot implications while reaching Paris Agreement compliant targets. We generated probabilistic climate outcomes from the scenario ensembles. We used the latest impact science to derive probabilistic climate impacts for a wide array of physical and economic indicators. Results show that the climate benefits of limiting overshoot can be important, especially for stringent climate targets with larger overshoot. The benefits occur for both physical and macroeconomic impacts, albeit interesting differences occur. Limiting overshoot is effective in reducing low-probability high-consequence climate change repercussions.This study is part of a multimodel comparison exercise, which also focuses on the near-term energy system investments16, the mitigation costs of overshooting17, and on the land-use sector18.This study involves nine global integrated assessment models: AIM/CGE, COFFEE, GEM-E3, IMAGE, MESSAGEix-GLOBIOM, POLES, REMIND-MAgPIE, TIAM-ECN and WITCH (Supplementary Information). These models have been widely used to assess global climate change mitigation pathways6,7,19. They are representative of a wide spectrum of approaches, spanning from simulation to optimization models, and from game-theoric frameworks to least-cost optimization models. They all have a detailed representation of the energy and land-use systems and a wide array of decarbonization options. Used in conjunction, the models generate an ensemble of pathways that span a plausible range of technological developments, allowing us to assess the results’ robustness and highlight trajectories characterized by fat tail risk where the likelihood of high impact is much greater than that of a normal distribution.Each modelling team followed the same protocol to ensure comparative results (Supplementary Methods). After 2020, the models impose a remaining carbon budget, that is, the cumulative CO2 emissions over the period 2018–2100, consistent with a given long-term temperature target, for two different scenario designs. The ‘End of Century’ (EOC) scenario design implements the remaining carbon budget without restriction, while the ‘Net Zero’ (NZ) scenario design implements the remaining carbon budget until CO2 emissions reach net zero CO2 emissions. After that point, net CO2 emissions are kept at zero. This ensures that the temperature peaks and stabilizes. The emission pathways are produced for a large range of remaining carbon budgets, from 500 GtCO2 to 2,000 GtCO2, to explore the space of climate targets systematically20. Models constrain their cumulative CO2 emissions and price the other greenhouse gases emissions at the CO2 price adjusted by the 100-year global warming potential equivalent. We compared the pair of trajectories produced by each model for the same remaining carbon budget (Fig. 1).Fig. 1: Influence of emission target formulation on the temperature and emission projections across models.a, The global mean temperature increase for an illustrative selection of model scenario combinations, leading to a similar temperature in 2100, likely 1.5 °C. Each subpanel displays two scenarios for the same amount of cumulative emissions. The NZ design is in blue, and the EOC design is in red and allows for overshoot. The difference between the two trajectories is highlighted in yellow. Historical temperatures from HadCRUT4 (ref. 35) are shown until 2019 by the black lines. The maximum temperatures of trajectories are indicated by horizontal dotted lines and their difference is shown beside each up arrow. b, The global CO2 emission projections for each model and scenario design, highlighting the ranges. c, The global non-CO2 emission projections (CH4, N2O and f-gases), expressed as CO2-eq using GWP-100. Differences between EOC and NZ are highlighted. The letters are the models’ initials. Extended Data Fig. 1 reports all temperature pathways of the cluster (likely 1.5 °C). Supplementary Fig. 28 provides model details for b and c.We used the climate emulator MAGICC21,22 to project the global mean temperature consistently across scenarios, in a setup reproducing the IPCC AR5 climate sensitivity uncertainty assessment23,24. EOC and NZ scenarios under the same budget lead to nearly the same temperature increase in 2100, but the timing and the level of the warming peak vary across scenario designs and across models (Fig. 1a). The IAMs do not directly control the overshoot magnitude, which instead depends on the model structure and its mitigation options. EOC scenarios rely heavily on negative CO2 emissions at the end of the century, while NZ scenarios reduce CO2 emissions earlier and to lower levels (Fig. 1b and Supplementary Fig. 22). As a consequence, peak warming happens earlier and is lower in the NZ scenario than in the EOC scenario (Fig. 1a and Supplementary Fig. 1).The cumulated temperature overshoot, that is, the cumulated difference in temperature between EOC and NZ along the century’s path (yellow area in Fig. 1a), depends on the model but also on the remaining carbon budget: the more stringent the remaining carbon budget and hence the lower the temperature increase in 2100, the larger the overshoot, robustly across all models (Supplementary Fig. 2). Similarly, the maximum overshoot, that is, the temperature difference between the maximum temperature in EOC and NZ, declines with larger remaining carbon budgets, although model differences exist (Supplementary Fig. 3). These temperature trajectories suggest that we could expect the largest climate impact differentials between EOC and NZ scenarios with smaller remaining carbon budgets.Across models, the same remaining carbon budget may not necessarily lead to the same 2100 temperature, as the models reduce the non-CO2 greenhouse gases emissions differently (Fig. 1c). As temperatures represent our key input to impact calculations, we clustered the model carbon budget pairs (EOC and NZ) according to the temperature reached in 2100. We characterized the scenarios as: likely 1.5 °C for a temperature of 1.55 °C in 2100, likely 1.6 °C for a temperature between 1.55 °C and 1.65 °C, below 1.8 °C for a temperature between 1.65 °C and 1.8 °C, and below 2°C for a temperature between 1.8 °C and 2 °C. The temperature clusters contained a similar number of scenarios for a diversity of models and temperature trajectories (Supplementary Table 1 and Figs. 1 and 23).We started off by gauging the probabilistic climate implications of a wide array of physical indicators on the basis of regional impact functions, also representing the uncertainty in the regional pattern of climate change from the models of the fifth phase of the Coupled Model Intercomparison Project (CMIP5) 25. The temperature distributions coming from the range of IAM scenarios of the comparison exercise were translated into physical impact distributions for each temperature cluster and scenarios. We produced the distributions for different impacts: heat extremes (four different indicators), energy demand (two), agriculture (seven) and water resources (two) at both the global and regional scale.The maximum geophysical impact over the century can help to compare the effect of the scenario design (Table 1 and Supplementary Figs. 4 and 6). The most striking difference was observed between likely 1.5 °C and below 2 °C, where the median values increased for all impacts, showing the high sensitivity of impacts to temperature2,4. The differences in impacts related to heatwaves were among the most severe. The regions most affected by the changes in heatwaves are Brazil, West and Southern Africa (Supplementary Fig. 7).Table 1 Global geophysical maximum impacts over the century. The table reports the median values, the 5th and 95th percentiles (in brackets) of the distributions of maximum impacts over the century for the NZ and the EOC, for two temperature clusters. The impact indicator definitions are provided in Supplementary Table 5We explored the role of temperature overshoot, comparing the characteristics of the impact distributions. The differences in median impacts between EOC and NZ scenarios were modest but still statistically indistinguishable (under the 90% confidence interval); for example, overshoot increased the median of maximum heatwave duration by 1 d for likely 1.5 °C scenarios and 0.4 d for below 2 °C scenarios (see also Fig. 2a). In addition, the maximum impacts were always lower in NZ scenarios, consistent with the temperature trajectories. The same conclusions held at the regional level, but with a different ranking for the various impacts (Supplementary Table 2).Fig. 2: Influence of the scenario design on the impact distribution.a, The probability density of the maximum heatwave duration over the century, expressed in days per year. The colour indicates the scenario design. Linetype distinguishes the temperature clusters. The vertical line shows the median. b, Plots of the probability of exceeding the threshold over time for heatwave duration, for the likely 1.5 °C cluster. The threshold is defined as heatwave duration over the century in the NZ scenario
https://www.nature.com/articles/s41558-021-01218-z
Net zero-emission pathways reduce the physical and economic risks of climate change