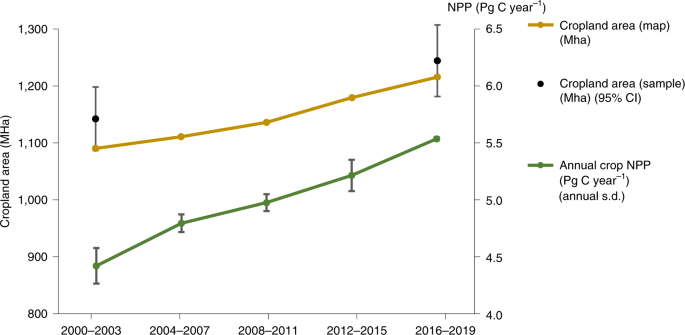
Global maps of cropland extent and change show accelerated cropland expansion in the twenty-first century Spatiotemporally consistent data on global cropland extent is essential for tracking progress towards sustainable food production. In the present study, we present an analysis of global cropland area change for the first two decades of the twenty-first century derived from satellite data time-series. We estimate that, in 2019, the cropland area was 1,244 Mha with a corresponding total annual net primary production (NPP) of 5.5 Pg C year−1. From 2003 to 2019, cropland area increased by 9% and cropland NPP by 25%, primarily due to agricultural expansion in Africa and South America. Global cropland expansion accelerated over the past two decades, with a near doubling of the annual expansion rate, most notably in Africa. Half of the new cropland area (49%) replaced natural vegetation and tree cover, indicating a conflict with the sustainability goal of protecting terrestrial ecosystems. From 2003 to 2019, global per-capita cropland area decreased by 10% due to population growth. However, the per-capita annual cropland NPP increased by 3.5% as a result of intensified agricultural land use. The presented global, high-resolution, cropland map time-series supports monitoring of natural land appropriation at the local, national and international levels. Global population growth and increasing standards of living inevitably cause the expansion and intensification of global agricultural land use to fulfil growing demands for food, biofuel and other commodities1,2,3. In turn, agriculture expansion and intensification threaten ecosystem functioning and lead to species extinction through habitat loss and fragmentation3,4,5,6. The United Nations’ 2030 Sustainable Development Goals (SDGs) call for balancing increasing agricultural production with maintenance of ecosystem services7. Implementation of SDGs to improve food security, protect freshwater and terrestrial ecosystems, and mitigate climate change requires national policies and international cooperation that are based on consistent, independent and timely data on agriculture extent and productivity8,9. Spatiotemporally consistent satellite observations provide the most accurate and cost-effective solution for global agricultural, land-use mapping and monitoring10. Satellite data have been shown to enable national and global agriculture mapping11,12,13,14,15,16,17. However, no globally consistent, multidecadal, cropland time-series data at locally relevant spatial resolutions (30 m per pixel) exist to date.In the present study, we present a global cropland extent and change dataset that can contribute to monitoring national and global progress towards SDGs. We define cropland as land used for annual and perennial herbaceous crops for human consumption, forage (including hay) and biofuel. Perennial woody crops, permanent pastures and shifting cultivation are excluded from the definition. The fallow length is limited to 4 years for the cropland class. Our definition is largely consistent with the arable land category reported by the Food and Agriculture Organization (FAO) of the UN18. To create the cropland dataset, we utilized the consistently processed 30 m spatial resolution Landsat satellite data archive19 from 2000 to 2019. The Landsat time-series data were transformed into multitemporal metrics that characterize land surface phenology. These metrics were used as independent variables for a machine-learning classification to map global cropland extent. The classification models were locally calibrated using extensive training data collected by visual interpretation of freely available, high-spatial-resolution satellite images. We used a probability sample, stratified based on the Landsat-based global cropland maps, to estimate cropland area and its associated uncertainty, and to analyse pathways of land-use conversion. Sample reference data were collected through visual interpretation of Landsat time-series data and higher-spatial-resolution satellite images. Cropland maps were integrated with the Moderate Resolution Imaging Spectroradiometer (MODIS)-derived annual net primary production (NPP)20 as a proxy variable for analysing crop productivity. The analysis was performed in 4-year epochs (2000–2003, 2004–2007, 2008–2011, 2012–2015 and 2016–2019). We created one cropland map per epoch (five maps in total), hereafter referred to by the last year of the interval (for example, the 2019 map represents the 2016–2019 epoch).Using probability sample data, we estimated the 2019 global cropland area to be 1,244.2 ± 62.7 Mha (the uncertainty represents the 95% confidence interval (CI)). Of the global cropland area, 55% is in Eurasia, 17% in Africa, 16% in North and Central America, 9% in South America and 3% in Australia and New Zealand (Table 1; see Extended Data Fig. 1 for region boundaries). During the first two decades of the twenty-first century, global cropland area increased by 101.9 ± 45.1 Mha, equivalent to 9% of the 2003 cropland area (Fig. 1). The largest cropland expansion was observed in Africa (by 53.2 ± 39.4 Mha, or 34%). South America had the largest relative cropland gain (by 37.1 ± 8.7 Mha, or 49%). Australia and New Zealand, as well as south-west Asia, displayed moderate cropland expansion (4 years). In North and South America, cropland expansion through the conversion of pastures and long fallows was more common (75% and 61%, respectively) than through clearing of natural vegetation24,25.Table 2 Relative importance of different types of land-use conversions for cropland establishment (gain) and abandonment (loss), estimated from sample reference dataAbandonment or conversion to other land uses affected 10% of the 2003 cropland area (115.5 ± 24.1 Mha). Of that area, 52% was either converted into pastures or abandoned (Table 2); such conversions may be temporary and followed by crop recultivation years later. Industrial and residential construction and infrastructure development were the second largest driver of gross cropland loss, responsible for 16% of the total cropland area reduction. In south-east Asia, 35% of cropland reduction was due to urban sprawl. A portion (13%) of 2003 cropland was converted to permanent woody crops or aquaculture, with the highest proportion of such transitions in south-east Asia (28%). Flooding caused by surface water increase, water erosion and reservoir construction affected the cropland area on all continents (3% total reduction). The remaining 16% of cropland reduction represented tree plantations or restoration of natural vegetation after cropland abandonment.Cropland dynamics on the continental and national scalesThe global Landsat-based, cropland map time-series is complementary to the sample analysis in characterizing global area dynamics (Fig. 3). The sample analysis showed high accuracy of the global cropland maps with variability between regions and lower accuracies for change dynamics (Table 3). The cropland map time-series allowed us to disaggregate change over time and conduct national-scale analyses.Fig. 3: Global cropland extent and change, 2000–2019.The map shows the proportion of stable cropland, cropland expansion and cropland reduction within 0.025° × 0.025° grid cells. The original cropland map time-series has a spatial resolution of 0.00025° per pixel, approximately 30 m at the Equator. Country boundaries are from GADM (https://gadm.org).Table 3 Regional and global map accuracy metricsGlobal cropland expansion accelerated over the past two decades, with a near doubling of the annual expansion rate from 5.1 MHa per year to 9.0 Mha per year (Table 4). The change in annual cropland expansion rates highlights differences between cropland establishment in Africa and South America. In Africa, cropland expansion accelerated from 2004–2007 to 2016–2019, with a more than twofold increase in annual expansion rates. In contrast, cropland expansion in South America decelerated by 2019, with an annual expansion rate reduced by almost half compared with the 2004–2007 interval.Table 4 Map-based annual cropland area changeAt the national level, the USA had the largest cropland area by 2019, closely followed by India and China (Supplementary Table 4). The largest net cropland increases were found in Brazil (by 23.1 Mha, or 77% increase over year 2003 cropland area) and India (by 15.5 Mha or 13%). The largest cropland area reductions were found in Russia (by 5.7 Mha, or 6% decrease over year 2003 cropland area) and Cuba (by 0.5 Mha or 28%).Per-country cropland area derived from our 2019 satellite-based map can be compared against the FAO’s arable land estimates for 2018 (ref. 22) (R2 of 0.97; Extended Data Fig. 3a) and with 100-m cropland fraction mapped by the Copernicus Moderate Dynamic Land Cover v.3 dataset17 (R2 of 0.96; Extended Data Fig. 3b). The differences between national cropland estimates for selected countries may be attributed to different factors. We suggest that, in Russia, where crop abandonment is widespread and not fully documented, the arable land is overestimated by the FAO. In Brazil and Paraguay, the Copernicus cropland fraction dataset shows almost twice the size of cropland area compared with our estimate. This overestimation is partly due to misclassification of pastures as croplands by the Copernicus dataset.Cropland NPP changeThe global MODIS-derived annual NPP within the cropland area (Extended Data Fig. 4) increased by 25% between 2003 and 2019 (from 4.4 Pg C year−1 to 5.5 Pg C year−1; Fig. 1). South America had the highest NPP increase (by 0.38 Pg C year−1, or 88%) followed by Africa (by 0.29 Pg C year−1, or 50%) (Table 5). The per-capita annual cropland NPP also increased globally by 3.5%, balancing the per-capita cropland area reduction. Two processes contributed to the global cropland NPP increase, namely the increase in cropland area and the increase in crop primary production per uni
https://www.nature.com/articles/s43016-021-00429-z
Global maps of cropland extent and change show accelerated cropland expansion in the twenty-first century