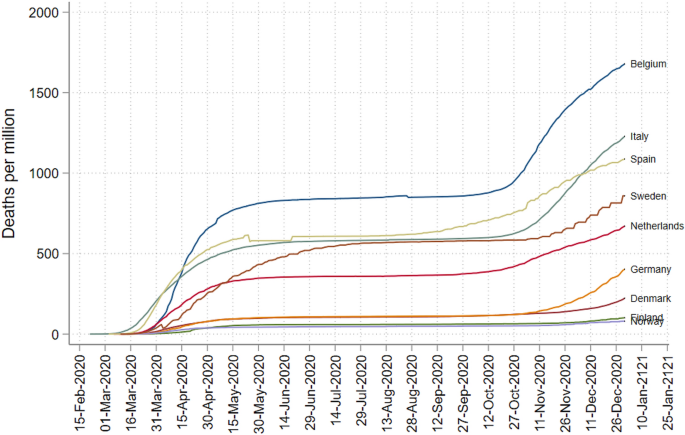
How a school holiday led to persistent COVID-19 outbreaks in Europe This paper investigates the role of large outbreaks on the persistence of Covid-19 over time. Using data from 650 European regions in 14 countries, I first show that winter school holidays in late February/early March 2020 (weeks 8, 9 and 10) led to large regional outbreaks of Covid-19 in the spring with the spread being 60% and up-to over 90% higher compared to regions with earlier school holidays. While the impact of these initial large outbreaks fades away over the summer months, it systematically reappears from the fall as regions with school holidays in weeks 8, 9 and 10 had 30–70% higher spread. This suggests that following a large outbreak, there is a strong element of underlying (latent) regional persistence of Covid-19. The strong degree of persistence highlights the long-term benefits of effective (initial) containment policies, as once a large outbreak has occurred, Covid-19 persists. This result emphasizes the need for vaccinations against Covid-19 in regions that have recently experienced large outbreaks but are well below herd-immunity, to avoid a new surge of cases. In early March 2020, Europe became the center of the Covid-19 pandemic, with the number of cases and deaths increasing exponentially. On March 11th the WHO declared Covid-19 a pandemic and containment measures intensified across Europe. Notable differences could however be seen both within and between similar countries. From Fig. 1 we can see how countries that had a relatively high number of deaths per capita in the spring are relatively hard hit from the fall. Hence, the patterns persist even after the summer holiday months, when the spread of Covid-19 appeared minimal.Figure 1Source: Figure created by the author using data from Dong et al.1.The cumulative number of confirmed Covid-19 deaths per capita in Europe (selected countries).In this paper, I contribute to the understanding of these patterns in the data. The main contributions are twofold. First, as Covid-19 was only found in a limited number of places in Europe in mid-February, human transportation was needed to distribute the virus to new places. I show that the clustered school holidays during this critical period played a large role in the initial distribution of Covid-19. Secondly, I show how the impact of large initial outbreaks still persists in the fall/winter of 2020 even after various efforts to contain the spread of Covid-19. Hence, areas with high initial exposure (school holiday in week number 9, 10 or 8) are consistently relatively worse hit in the fall and early winter 2020.First cases of Covid-19 were identified in Europe in January 2020 and only sporadic cases reported until middle of February. From the WHO Covid-19 situation report on February 21st, only 47 cases had been confirmed in Europe and 1200 outside of China, over half of which were linked to the Diamond Princess cruse-ship. The situation escalated rapidly in Europe from this point, and on March 13th the Director-General of the World Health Organization noted that ‘Europe has now become the epicenter of the pandemic, with more reported cases and deaths than the rest of the world combined, apart from China.’ Hence, in the short time-span from the 21st of February until the 13th of March, Covid-19 took hold and spread uncontrolled throughout Europe.During this pivotal period, in late February and early March, many European countries had school holidays. The specific naming and purpose varies from e.g. winter sport-holidays, half-term holiday, carnival/crocus and some even had early spring breaks. The generic term school holiday is used in this paper to describe all school holidays at the primary and secondary education level in the period of interest (January to March 2020).Before proceeding further, it is useful to create a timeline for the spread of Covid-19 in Europe to pinpoint which weeks were, at the time, thought to have been safe for travel and which weeks, ex-post, are most likely related to high exposure. From Fig. 2 we can see that only a handful of confirmed cases were being reported in weeks 6 and 7 and only after February 20 did the number of (confirmed) cases start increasing rapidly. We can therefore broadly generalize the likely impact of the school holiday by week.Figure 2Source: Figure created by the author using data from Hasell et al.2.The number of new confirmed cases of Covid-19 in Europe in late February/early March 2020. Week 7 (10–16 February or earlier): A school holiday during or before week 7 is not likely to spark a large outbreak, as the spread of Covid-19 was sporadic/localized, with the number of confirmed daily cases below 10 in Europe. Week 8 (17–23 February): By the end of week 8 the number of reported cases was increasing, suggestive of local transmission. Number of daily cases reached around 100. Week 9 (24 February–1 March): During this week, the number of cases increased rapidly, with daily cases above 750 by the end of the week. Week 10 (2–8 March): During week 10 the exponential spread continued with over 2000 daily cases at the end of the week. From late week 10 and start of week 11 the severity of the pandemic becomes more tangible through, for example several, large (global) stock market declines (March 9th, 11th, 12th and 16th), WHO declared Covid-19 a pandemic and the US travel ban on many European countries (both on March 11th). It is important to stress that the number of cases during these weeks is now known to have been underestimated, as most cases were undetected3. However, the numbers give a good picture of how the spread of Covid-19 was thought to have been at the time. Public awareness of the seriousness prior/during travel was low until late week 10 (early week 11). Hence, a traveler in week 6, 7, 8 or 9 would only see a limited number of confirmed cases prior to travel (in weeks 5, 6, 7 and 8) but the likelihood of being exposed to Covid-19 would be vastly different. Unaware individuals traveling in the high-exposure week 9 are therefore likely to have provided human transport of Covid-19 to their local area. During the short time window around week 9, the risk of being exposed to Covid-19 during travel was high, while the perceived risk was low. As the awareness of the risks was still rather low on return, these individuals are in addition likely to have started their normal lives before the seriousness of the spread was apparent across Europe, amplifying the local geographic exposure. A similar argument applies for week 8, but from a lower base. While the spread was higher in week 10, than 9, the seriousness was more noticeable and hence less clear if week 10 travelers are more or less likely to have brought Covid-19 to their home region.Contact tracing data from Denmark, Sweden and Norway, provides evidence that the surge of cases in March 2020 was mostly related to traditional winter holiday destinations such as Austria (1150 cases) and Italy4. Similar evidence is provided from analyzing haplotypes in Denmark and Iceland5,6). Notable as well, that during extensive contact tracing in Iceland in March/April 2020, only 2 of the 200 cases could be traced to foreigners/tourists. Hence, the bulk of the initial spread could be attributed to locals returning from abroad and related subsequent spread7.School holidays in Europe vary considerably, both within and across countries. Some countries lump the break in a single week (Belgium in week 9) others stagger the break over multiple weeks (e.g. Netherlands, Sweden, Germany, Slovakia, Denmark). Given the timeline constructed above, we expect the likelihood of a regional outbreak to vary substantially depending on the week of the school holidays. Regions with a school holiday prior or during week 7 are not likely to experience outbreaks, but as the pandemic intensifies over time, the likelihood increases of a large clustered outbreak on return from travel. The school holidays may therefore lead to both within and cross-country variation in the initial spread of Covid-19. Since school holidays are generally either region-week or country-week specific, they may lead to multiple simultaneous introductions of Covid-19. The geographic and week wise clustering of school holidays increases therefore the likelihood of multiple simultaneous independent cases being introduced into a sub-national area upon return from travel during the school holiday. This clustering is significant since8 find that once at least four (ten) independent cases of Covid-19 have been introduced into a new location, there is over 50% (90%) chance that a large outbreak will occur. This also underscores why school holidays are potentially more significant for the initial exposure than business travel, which tends to be less clustered by both geography and time.To isolate the impact of the school holidays, we use only data from countries that fulfill the following criteria: (1) the regional variation in school holidays is clear and clustered in both time and space, and (2) the domestic spread did not take off due to other events during the holidays. See Appendix B for more information.Figure 3Source: The data used to create figures (b and c) come from9. The source files for the map borders come from10. The maps are were created by the author using the statistical software package Stata, version 16 (see https://www.stata.com/).Comparison of school holidays and cumulative number of Covid-19 cases (until end of November 2020).From the maps in Fig. 3 we can see a comparison of the cumulative number of cases per capita up to end of November 2020 and a comparison with school holiday weeks. The map shows the number of cumulative cases of Covid-19 per capita (b), and the number of cases in a country relative to the median in that country (c). Investigating these maps, we can see some clear patterns. In the Netherlands, the southern part (week 9 holiday) has been harder hit than the northern week 8 holiday regions. Looking within Germany, regions with school holidays in weeks 8–10 have relatively higher number of cases of Covid-19. Belgium, the hardest-hit country in the EU, has a nationwide school holidays in week 9 as well as Stockholm, the badly affected capital of Sweden. See Tables D2, D3 and D4 in Appendix D for descriptive statistics on the school holiday weeks.To investigate if school holidays in weeks 8, 9 and 10 led to large outbreaks in the spring and can explain subsequent spread of Covid-19, we first collect data on school holidays across Europe. The main source on school holidays is Eurydice network11established by the European Commission, which collects yearly information on the structure of the school year in Europe. This is then cross-referenced with other sources, see data Appendix A.Several datasets on the spread of Covid-19 are used. First, we use data that has been collected and harmonized on case counts of Covid-19 at the NUTS 3 level for a number of European countries9. The NUTS classifications are a hierarchical system used in the EU based on administrative borders. NUTS 3 are small regions, NUTS 2 are larger areas, while NUTS 1 are major socio-economic regions. For the first part of the analysis, I use Covid-19 case numbers from 650 regions in 14 European countries. Secondly, data from RKI Germany is used for Covid-19 related deaths. See Appendix A for more information on data and Appendix B for more details on the selection of countries.To assess if the timing of school holidays is important for the spread of Covid-19, we run a standard OLS regression to estimate Eq. (1). In this regression we try to explain the number of cases of Covid-19 per NUTS 3 region (ln number of cases) with a single joint dummy variable (break) for regions that have school holidays in weeks 8, 9 or 10.$$begin{aligned} ln(cases)_{r} = beta _{1} break_{r} + region_{r} + CD_{c} +epsilon _{r} end{aligned}$$I run a cross-sectional regression separately for each month (11 regressions) to investigate not only if late school holiday (weeks 8, 9 or 10) were important for the initial exposure, but also persistence over time. The cases are first aggregated to 7-day intervals and then to the monthly level, which roughly correspond to a month. A number of NUTS 3 specific control variables ((region_{r})) from Eurostat are added. These include a categorical variable on urbanization (three categories predominantly urban, intermediate and predominantly rural), population, regional income, area(km sq.), median age and percentage of people below 14 and share above the age of 60. The inclusion of these variables controls for the cross-region demographics and importantly variation in population density in terms of number of inhabitants, typology (urban-rural) and geographic size. Errors are clustered at the NUTS 2 level.Recall that in Eq. (1) we include dummy variables for regions that have a school holiday in either week 8, 9 or 10 (break equals 1 if region had a school holiday in either week 8, 9 or 10). In practice, this means that we are comparing regions that had a break in these higher exposure weeks to regions that had a school holiday break in week 7 or earlier (controlling for regional variables as noted above). In addition, we add a country specific dummy ((CD_c)) to the regression. As we know, testing strategies vary significantly between countries and the inclusion of a country specific effect accounts for such differences. By using a country specific dummy, we are effectively using variation within a country to identify the effects. Note that countries with the same school holiday profile may still experience a variation in the overall level of cases coming in to the country, stemming from the country specific propensity to travel abroad during the school holiday. See also a discussion in Appendix C (Table C1) on travel patterns to the known hot-spots in the alps in February and March 2020. As the response in the spring was mostly country specific, containment policy should not play a large role in the relative distribution of cases within a country. The country specific fixed effect will, for example, capture country specific lockdowns or other containment policies.The identification strategy employed uses the fact that school holidays are decided long in advance and the exact timing is naturally exogenous to the spread of Covid-19 in February/March 2020. In addition, it is important to highlight two further aspects. First, by using country specific effects ((CD_{c})) we exploit only regional within-country variation. Countries without variation in the timing of school holidays will therefore not contribute to the estimate of (beta _{1}) (Belgium for example only had a holiday in week 9). Second, regional characteristics ((region_{r})) are added to account for observed regional differences (e.g. density, age profile). Hence, we compare regions which had a holiday in week 8 or later (‘treated’) to regions, within the same country, that had a holiday in week 7 or before (‘controls’) after accounting for observed country and regional level differences. Using Germany as an example, we compare regions in Bavaria (week 9) and Hamburg (week 10) to Berlin (week 6) and regions in North Rhine-Westphalia (no school holiday) after controlling for regional characteristics. To summarize, I argue that given the exogeneity of the exact timing of holidays, and controls for observed differences, we are able to infer the role of school holidays on the initial spread of Covid-19.Figure 4 shows the OLS estimation results from these eleven monthly regressions. We can see clearly that regions with a school holiday in week 8, 9 or 10 had a considerably higher spread of C
https://www.nature.com/articles/s41598-021-03927-z
How a school holiday led to persistent COVID-19 outbreaks in Europe