For all panels, we performed simulation based on 124,080 SNPs (a union of 36,987 UK Biobank (UKBB) array SNPs and 93,767 HapMap3 SNPs) on chromosome 2. We trained the PRS model on either the HapMap3 + UKBB SNPs (all causal variants are observed in the training data) or UKBB SNP panel (~70% of causal variants are excluded). (a) Calibration of ρ-level genetic value credible interval. The x-axis is the expected coverage of ρ-GV CI (that is ρ). The y-axis is the empirical coverage calculated as the proportion of GV CIs that contain the true genetic value in one simulation replicate. (b) Calibration of ρ-level rank credible interval. The x-axis is the expected coverage of the rank CI (ρ). The y-axis is the empirical coverage calculated as the proportion of ρ-rank CIs that contain the true rank of individual among testing individuals in one simulation replicate. (c) Calibration of probability of GV above threshold t. The x-axis is the expected probability set as middle of each bin. The y-axis is the empirical probability calculated as the proportion of individuals having GV within the lower and upper bound of the bin of one simulation replicate. Different colors represent different prespecified thresholds. (d) Distribution of individual PRS scaled standard deviation. For (a-c), the dots and error bars are mean ±1.96 s.e.m empirical coverage/probability calculated from 10 simulation replicates. For (d), the boxplot center line is the median; the lower and upper hinges correspond to the first and third quartiles, and boxplot whiskers extend to the minimum and maximum estimates located within 1.5 × interquartile range (IQR) from the first and third quartiles, respectively.
https://www.nature.com/articles/s41588-021-00961-5
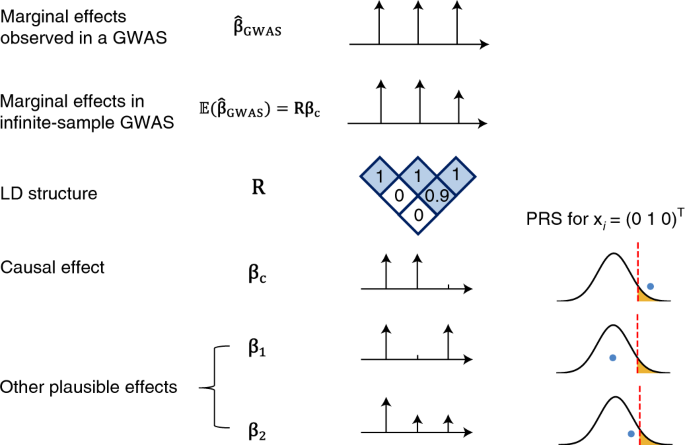
Large uncertainty in individual polygenic risk score estimation impacts PRS-based risk stratification