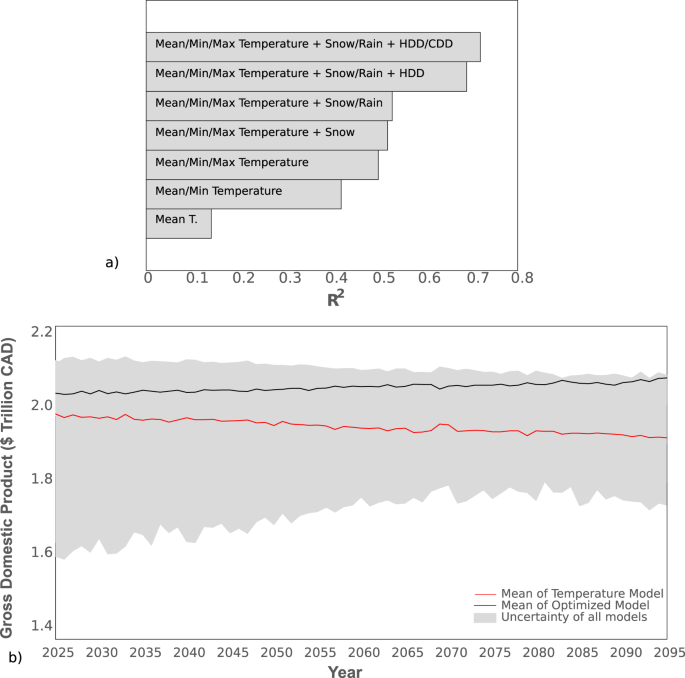
Financial stability in response to climate change in a northern temperate economy Climate change will have considerable impact on the global economy. Estimates of the economic damages due to climate change have focused on the effect of average temperature, but not the effect of other important climate variables. Related research has not explored the sub-annual economic cycles which may be impacted by climate volatility. To address these deficits, we propose a flexible, non-linear framework which includes a wide range of climate variables to estimate changes in GDP and project sub-annual economic cycle adjustments (period, amplitude, trough depth). We find that the inclusion of a more robust set of climate variables improves model performance by over 20%. Importantly, the improved model predicts an increase in GDP rather than a decrease when only temperature is considered. We also find that climate influences the sub-annual economics of all but one province in Canada. Highest stressed were the Prairie and Atlantic regions. Least stressed was the Southeastern region. Our study advances understanding of the nuances in the relationship between climate change and economic output in Canada. It also provides a method that can be applied to related economies globally to target adaptation and resilience management. Over the past decade, research has focused on understanding the interaction between climate change and the global economy1,2,3,4. Shifts in temperature and precipitation patterns and extreme weather events will drive projected economic damages3,5,6,7 and create risks to infrastructure and financial stability1,8,9. Climate change has already impacted economic stability: For example, the cost of debt in V20 (Vulnerable 20) countries has increased by $40 billion in the past decade10. A critical challenge to financial stability includes climate-induced physical risks, of which the increased severity and frequency of acute events such as hurricanes, floods, droughts, and heatwaves are particularly impactful11,12,13,14. As a result, there is increased interest from government and financial institutions to incorporate climatic risk into adaptation and resilience management at the local, regional, and national level14,15. A focus of those efforts is to identify areas of investment that increase social preparedness and buffer infrastructural burdens due to physical climate risks14. Adaptation and resilience management must be heavily targeted at sub-national levels as the impacts felt at local levels are expected to exceed global level trends15.While estimates of economic impacts due to climate change are aligning1,16,17, the approaches employed in previous literature focus predominantly on probabilistic modelling and lack attention to critical elements11,12,18. Climate-related economics only accounts for a fraction of the existing research, with limited attention to financial stability (Supplementary Fig. 1). Moreover, recent literature has highlighted the need to better understand aggregated economic output in addition to damages19. The existing literature in climate-related economics primarily used average temperatures in assessments, with no consideration for other climatic variables that may impact climate-related damage estimates1,11,12,16,17. Additional gaps centre on the lack of attention to sub-annual data, a temporal resolution that can capture economic cycle components (e.g., recession timing and trough depths) related to financial stability1,16,17,20.In this work, we outline an empirically based method to project economic changes due to climatic change. We reveal sub-annual economic cycle changes across geographic regions, with particular focus on changes in cycle length, amplitude, and trough depth, as these contribute to financial stability. The performance of common models and importance of a comprehensive suite of climate variables were determined. Canada was chosen to exemplify our method as it is consistently one of the top global economies, one of the most robust, and the fastest growing G7 country prior to disruptions caused by the Coronavirus Pandemic21,22. As a northern temperate economy, Canada faces complex climate change caused by disproportionate warming (i.e. warming more than double the global average)23 and a longitudinal and latitudinal breadth that experiences a range of climate variability24,25. As such, application of our methods to Canada provides a comprehensive example that demonstrates many common challenges faced in economies with less complex climate scenarios. Our study advances understanding of the impacts of climate change on economies and offers insights to guide research and policy development, particularly in other northern temperate economies.Inclusion of a broad suite of climate variables improves the accuracy of models which attempt to quantify climate−economic relationships. Mean temperature alone explains up to 40% of model variability in Canadian GDP (Fig. 1a). However, the inclusion of precipitation and snow improved the explanation of model variance by 10 % (R2 to 0.53; GR2 = 0.38). Heating and cooling degree days further improved the explanation of variance by 19% (R2 to 0.72; GR2 = 0.5) (Fig. 1a). Quantified economically, annual GDP in 2095 was under-predicted by $400 billion CAD (20%) under the high emissions climate scenario (RCP 8.5) when mean temperature was the only climate variable considered compared to the optimized MARS model (Supplementary Figs. 2 and 3 and Supplementary Table 1).Fig. 1: Relationship between climate variables and Canadian gross domestic product (GDP).a Accumulated variance explained within the national monthly MARS model. Each bar indicates the R2 value of a MARS model run according to an incremental increase of one climate variable. b Mean Canadian GDP projected from 2025 to 2095 under a high emissions climate scenario (i.e., Representative Concentration Pathway 8.5). Shown are the optimized national model (black), temperature-only model (red), and the range for all other stepped models (grey). GDP does not account for a mean historical annual growth of 2.6% and only indicates the changes based on climatic volatility.When applied to the Canadian economy from 2025 to 2095 in a high emission climate change scenario (RCP 8.5), our model projects an annual increase of 0.03% above the normal average GDP growth rate from the past two decades (i.e., 2.6%) (Fig. 1b). Over that 70-year projection period, total annual GDP was estimated to be 2.5% higher than current values based solely on climatic change. When only temperature variables were considered, GDP decreased by 0.04% annually, or 2% by 2095 (Fig. 1b). Moreover, the cumulative difference was projected to be 5%, or $7.4 trillion CAD, over the projection period (Fig. 1b). These values of GDP only indicate changes based on climatic volatility and do not account for the mean historical annual growth of 2.6%.Regional economic variability due to climate changeThere are four main Canadian regions with similar climatic conditions and economic drivers26. These regions include the Pacific Maritime/Western Cordillera, which includes British Columbia, Prairie/Northwestern Forest, which includes Alberta, Saskatchewan, and Manitoba, Southeastern/Northeastern Forest, which includes Ontario and Quebec, and Atlantic Maritime, which includes Nova Scotia, New Brunswick, Newfoundland and Prince Edward Island. The influence of a broad set of climate variables at this regional level was similar to the national level using the MARS model. While mean temperature and precipitation were significant, neither was the most explanatory variable at the regional level (Supplementary Table 2). Cold weather variables, including Snow, Heating Degree Days, and Minimum Temperature, were apex in the majority of regions (Supplementary Table 2). When assessed at a seasonal level, the primary variable of influence varied by province and region, with minimum and maximum temperature the most prevalent in the Prairies, and precipitation and maximum temperature most common in Southeastern Canada. The Atlantic Maritime region was not decomposed into season-specific models.When regional MARS models were projected to 2095, we found that GDP varied by region (Fig. 2a and Supplementary Fig. 4). Most of the variability and the greatest changes in GDP projections were associated with the Prairie region. Projected changes to GDP were on average 3.2%, −12.6%, and 11.4% for Alberta, Saskatchewan, and Manitoba, respectively (Fig. 2b and Supplementary Table 3). Uncertainty due to climate model projections was also high in this region (Fig. 2b–d). Historically, the Southeastern region contributed to the bulk of national GDP (i.e., more than 55%) (Statistics Canada). Economic productivity was projected to increase (p < 0.05). GDP in Ontario and Quebec were projected to increase by 1.1% and 3.9%, respectively (Fig. 2c). Projections in the Atlantic Maritime were also highly variable, with provinces showing either significant increases or decreases in GDP (Fig. 2d; Supplementary Fig. 4 and Supplementary Table 3). The Pacific Maritime region (i.e., British Columbia) showed no significant changes to productivity, but also had the mildest projected changes in climate amongst provinces27.Fig. 2: Provincial annual trade projections across regions from 2025 to 2095 under a high emission climate scenario (i.e., Representative Concentration Pathway 8.5).a Regions with similar climatic and economic drivers: Pacific Maritime includes British Columbia (BC), Prairie includes Alberta (AB), Saskatchewan (SK), and Manitoba (MB), Southeastern includes Ontario (ON) and Quebec (QC), and Atlantic Maritime includes New Brunswick (NB), Nova Scotia (NS), Newfoundland (NL), and Prince Edward Island (PEI). b–e Annual trade projected with MARS models optimized by province (black), and the total range of trade projected from all 24 Coupled Model Intercomparison Project 5 data (grey). Projections are shown by region: b Pacific Maritime, c Prairie, d Southeastern, and e Atlantic Maritime.Economic cycle stress due to climate changeIn addition to total changes in GDP, we assessed the impact of climate change on the period (i.e., duration of economic season), amplitude (i.e., greatest or least economic output per season), and trend in economic cycles in Canada (Supplementary Table 4). Changes to the economic cycle varied by region. We conceptualized those changes into four categories, and associated quadrants in Fig. 3, of stress to existing economic infrastructure (Fig. 3a): (I) much higher stress (i.e., increased period and amplitude), (II) higher stress (i.e., decreased period and increased amplitude), (III) much lower stress (i.e., decreased period and amplitude) and (IV) lower stress (i.e., increased period and decreased amplitude). In the 'much higher' stress quadrant, more economic output, due to favourable climatic conditions, would be required over a longer period. This could mean additional load on infrastructure for an extended duration. In the 'higher' stress quadrant, more economic output would be required over a shorter period, again requiring infrastructure to support additional load. In lower stress quadrants, infrastructure would be required to support less load (Fig. 3a).Fig. 3: Stress to provincial economic cycles and credit risk in response to climate change from 2025 to 2095 in a high emissions climate scenario (i.e., Representative Concentration Pathway 8.5).a Conceptual representation of economic cycle stress according to changes in cycle period (blue) and amplitude (black) by quadrant. Quadrants on the left and right show decreased and increased period, respectively. Top and bottom quadrants show increased and decreased amplitude, respectively. b Economic cycle changes and credit risk by province. Changes in amplitude are the percentage change in total trade, while changes in period are in months. Provinces are labelled British Columbia (BC), Alberta (AB), Saskatchewan (SK), Manitoba (MB), Ontario (ON), Quebec (QC), New Brunswick (NB), Nova Scotia (NS), Newfoundland (NL), and Prince Edward Island (PEI). Quadrants are labelled according to categories of stress: (I) Much higher, (II) Higher, (III) Much lower, (IV) Lower. Credit risk is coloured according to change: Neutral (grey), increased (brown) and decreased (green).Provinces estimated to be most stressed by climate change (i.e., greatest change in cycle period and amplitude) included Alberta, Saskatchewan, Prince Edward Island, and New Brunswick. In particular, increased amplitude and decreased period suggest increased volatility, or reduced stability (Fig. 3b and Supplementary Table 4). Those provinces in quadrant III, such as Ontario and Quebec, were estimated to be least impacted with slightly decreased amplitude and period (Fig. 3b). Highly stressed provinces such as Alberta, New Brunswick, Prince Edward Island, and Saskatchewan may experience more extreme trough depth and associated recession severity (Fig. 3b). The opposite is true for Ontario and Quebec given reductions in trough depth.Regional economic interdependenciesInterdependency of trade among provinces was the final component of the economic projections in this study. Southeastern Canada was projected to stabilize (based on amplitude, cycle length, and trough depth) with climate change (Fig. 3), which may improve financial stability in other parts of Canada as it is one of the largest trading partners with all other regions (Fig. 4). Saskatchewan's trade was projected to be most at risk with 48% of its imports derived from high stress zones. Stressed provinces, such as Alberta, Saskatchewan, New Brunswick, and Prince Edward Island, account for an average of 30% of trade across all provinces. Of these provinces, Alberta comprises the majority of the exports, indicating that resilience and adaptive management policies should focus on this province to mitigate climate-related damages.Fig. 4: Projected percentage of interprovincial trade impacted by climate between 2025 and 2095 in a high emission climate scenario (i.e., Representative Concentration Pathway 8.5).Provinces coloured green were projected to have increased gross domestic product (GDP) and decreased credit risk, while those coloured yellow were projected to have increased credit risk. Provinces coloured brown were projected to have decreased GDP and increased credit risk. The percentage of imports at risk in each province are listed on the far right.Other models in the literature that estimate total GDP impact due to climate change have been criticized for not effectively resolving the contribution of cold weather variables16,17,28. Such models generally show GDP to decrease17, or increase minimally11. Our model shows similar trends, but only when temperature was considered alone. We found that a range of explanatory climate variables were both significant in our model and improved performance by 20%. When the range of variables were considered, our model no longer predicted decreased GDP, but rather increased GDP. The increase was 2% greater than other studies that showed short-term GDP growth16,17. Our results indicate that using temperature alone as an explanatory variable in e
https://www.nature.com/articles/s41467-021-27490-3
Financial stability in response to climate change in a northern temperate economy