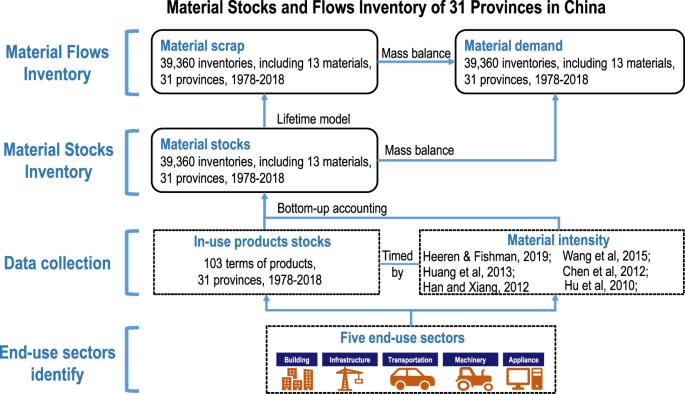
China material stocks and flows account for 1978–2018 Data Descriptor Open Access Published: 25 November 2021 Lulu Song1,2,3, Ji Han4,5, Nan Li1,2,3, Yuanyi Huang1,6, Min Hao7, Min Dai8 & Wei-Qiang Chen orcid.org/0000-0002-7686-23311,2,3 Scientific Data 8, Article number: 303 (2021) Cite this article As the world’s top material consumer, China has created intense pressure on national or global demand for natural resources. Building an accurate material stocks and flows account of China is a prerequisite for promoting sustainable resource management. However, there is no annually, officially published material stocks and flows data in China. Existing material stocks and flows estimates conducted by scholars exhibit great discrepancies. In this study, we create the Provincial Material Stocks and Flows Database (PMSFD) for China and its 31 provinces. This dataset describes 13 materials’ stocks, demand, and scrap supply in five end-use sectors in each province during 1978–2018. PMSFD is the first version of material stocks and flows inventories in China, and its uniform estimation structure and formatted inventories offer a comprehensive foundation for future accumulation, modification, and enhancement. PMSFD contributes insight into the material metabolism, which is an important database for sustainable development as well as circular economy policy-making in China. This dataset will be updated annually. Measurement(s) Material stocks • Material flows Technology Type(s) digital curation • Mathematical Model Sample Characteristic – Location China Machine-accessible metadata file describing the reported data: https://doi.org/10.6084/m9.figshare.16601249 Modern society is enabled by the use of various materials1,2. The 20th century is an era of explosion of human civilization and accomplished achievements, which is accompanied by the ever-accelerating annual extraction of biomass by a factor of 3.6, of fossil fuels by 12, of ores and minerals by 27, and of construction materials by 34 times1,3,4,5,6. Foreseeably, with deepening urbanization in developing countries, the size of material stocks in human societies will continue to grow. According to the reports of the United Nations Environment Program (UNEP), the consumption of biomass, minerals, and ores per year will triple between the present and 20507. With the intensified resource stresses, material metabolism has been the research hotspot of sustainability science7,8.Sustainability science is rapidly evolving and increasingly changing into data-intensive. As one of the concerns of sustainability science, material metabolism, which quantifies the flows of materials and energy into and out of human societies, urgently needs the material stocks and flows data to describe and analyze the metabolic processes8,9,10. Furthermore, based on the material stocks and flows data, material efficiency11,12, criticality13,14, and recycling15,16 may be directly analyzed, and related properties, such as energy consumption17, greenhouse gas emissions18, and future material demand19 can be easily and exactly traced. Hence, an accurate accounting of material stocks and flows data is the premise for achieving the above-mentioned goals.As the world’s top material consumer, China has created intense pressure on national or global demand for natural resources7. With rapid urbanization and industrialization, the materials stocks in China have been experiencing a sharp increasing pattern4,19,20,21,22, and China’s share of global material stocks increased from 10% to 22%4. It has been catching up with developed countries since the 1990s, and only took 20 years to get to the stocks level that industrialized countries had achieved within 70 years. Diverse material stocks have increased exponentially in China: steel stocks increased 2.5-fold in a decade23; aluminium stocks rose 100-fold during 1950–200924; copper stocks increased 50-fold during 1952–201525,26; cement stocks increased by 40 times during 1990–201021. China’s accelerating materialization process creates serious environmental problems27,28, which makes understanding the material metabolism crucial for implementing effective resource management policies and providing valuable insights into promoting circular economy9. However, the material stocks and flows account in China and each province have not been well reported and published. Although previous studies have estimated China’s material stocks20,21,29,30,31, there is considerable disagreement on the stocks level between these studies. For example, Krausmann et al.4 estimated that the material stocks in China amounted to 136 t/cap in 2010 based upon the top-down approach, while Han and Xiang19 estimated the result to be only 33 t/cap in 2008 based upon the bottom-up approach. The difference may be explained by the inconsistent system boundaries, identified end-use sectors, data sources, and estimation approaches, which makes it difficult to clarify the pattern of material use and identify the mechanism of material metabolism.Considering the great discrepancies of material stocks account and the lack of provincial material stocks and flows account in China, this paper creates the first version of the Provincial Material Stocks and Flow Database (PMSFD), which contains 13 materials’ stocks and flows in five end-use sectors in 31 provinces of mainland China. The spatial scale of PMSFD ranges from province to nation, and the timescale ranges from 1978 to 2018. There are 200,000 + data records stored in the PMSFD, and we also provide the material intensity used in the estimation for transparency and verifiability. By integrating data records into a unified format, PMSFD has taken a step towards overcoming the limited accessibility due to incomplete data availability.The comprehensive and consistent data records make the PMSTD an important database for sustainability analyses and assessments. For example, PMSTD may be used to facilitate retrospective analyses and prospective forecasts of stocks and flows to assist in identifying and achieving sustainable development. We will advance this goal through this initial version of PMSTD, and update the PMSTD annually. The rest of this paper introduces the estimation approach used to create the PMSFD, the file format used to record the PMSFD, and the properties of the data in the PMSFD.A PMSF (Provincial Material Stocks and Flows) model, which combines a bottom-up, stocks-drive-flows, and mass-balanced dynamic model, is constructed for material stocks and flows estimates at the provincial level. This combined model can evaluate material inputs, stocks accumulation, and end-of-life outflows. Considering the availability of intensity data and the wide application in society, 13 types of materials, including steel (Fe), aluminium (Al), copper (Cu), rubber, plastic, glass, lime, asphalt, sand, gravel, brick, cement, and wood, are considered in this study. Drawing on a comprehensive provincial product database, annual provincial material uses and flows are estimated. The time horizon is from 1978 to 2018 and all computations are performed in time-discrete steps of one year. The spatial scope covers 31 provinces in mainland China. The workflow is shown in Fig. 1 and is described in detail in the following sections.Fig. 1Diagram of material stocks and flows inventory construction.Material stocksThe bottom-up accounting method, which starts from counting every piece of material-containing products, then investigates the material intensity for each product, and finally adds up material contained in all product categories, could complement the top-down method by revealing greater details of technologies and identifying geographical locations of material stocks23. Since the physical data of product stocks are becoming available on provincial scale, the bottom-up approach is appropriately adopted to estimate the material stocks ((Sleft(tright))).A list of 103 commodities, which are divided into five end-use sectors (including buildings, infrastructure, transportation facilities, machinery, and domestic appliances), is identified and revised based on our earlier study19 (Online-only Table 1). Unlike our previous research, we have primarily adjusted the commodities identified in the end-use sectors of buildings and infrastructure. For example, we have added different types of highways, power stations, and cable users in the infrastructure, while removing different structures of residential buildings. The material stocks (({S}_{bar{C}})) in each end-use sector ((bar{C})) at the time t are then calculated as the sum of material stocks of related products (Eq. 1).$${S}_{bar{C}}left(tright)=sum _{i}{N}_{i}(t)times {I}_{i}(t)$$where ({N}_{i}left(tright)) is the amount of product i in active use in the end-use sector (bar{C}) at time t and ({I}_{i}(t)) is the material intensity of product i.The number of product ({N}_{i}) quantified by per-household, absolute, or per-capita (Online-only Table 1) is extracted from various official statistical reports, yearbooks, and socio-economic databases (including https://data.stats.gov.cn and http://www.data.ac.cn) for each province during 1979–2019 (see ref. 19 for detail). Owing to limited data availability for the individual years, linear interpolation has been used to estimate the missing data between consecutively recorded values32.The material intensity is sourced from various references and estimated based on expert judgements10,20,23,24,30,33, which are also provided in our datasets.The total material stocks (Sleft(tright)) are calculated as the sum over the five end-use sectors at the time t (Eq. 2).$$Sleft(tright)=sum _{bar{C}}{S}_{bar{C}}(t)$$Residential and non-residential buildings (including buildings of public and industry) are considered when calculating the material stocks in buildings. Unlike residential buildings, the floor space of non-residential buildings is not officially reported in each province. Instead, the floor space of public (({f}_{p})) and industrial buildings (({f}_{i})) in towns and townships in each province are recorded by China Urban-Rural Construction Statistical Yearbook for years (http://www.mohurd.gov.cn/xytj/tjzljsxytjgb/jstjnj/index.html)34. Hence, we estimate the material stocks in non-residential buildings by assuming that the ratio between non-residential and residential buildings in towns (or townships) applies to the urban (or rural) in each province (Eqs. 3–4).$$R(t)=left({f}_{p}(t)+{f}_{i}(t)right)/{f}_{r}(t)$$$${F}_{UR}(t)=left({A}_{CR}(t)times P(t)right)times R(t)$$where (R(t)) is the proportion of floor space of non-residential buildings to residential buildings in urban (or rural) at time t, ({f}_{p}(t)) and ({f}_{i}(t)) are the floor space of public and industrial buildings in town (or township) for each province at time t, ({f}_{r}(t)) is the floor space of residential buildings in town (or township) for each province at time t, ({A}_{CR}(t)) is the per-capita floor space of residential buildings in (or rural), and (P(t)) is the urban (or rural) population at time t. For the period 1978–2001, ({f}_{p}(t)), ({f}_{i}(t)) and ({f}_{r}(t)) are held constant at the level of 2002, since these data are unavailable before 2002.In addition, due to limited official reporting data for (large, medium, small, and micro) passenger cars and (heavy, medium, light, and micro) trucks in each province before 2001, we use the proportion of the different sizes of passenger cars and trucks in 2002 to extrapolate the numbers during 1978–2001. Meanwhile, it is difficult to identify the amount of machines used in diverse industries. We evaluate the metal stocks in industrial machinery by supposing that there is a directly proportional relationship between power consumption and the amount of industrial machines, which is recommended by Zhang et al.29 and Liu et al.32.Material flowsThe material outflow at the time t is defined as the scrap generated from stocks from the end-use sector (bar{C}) of material m, and material inflow at the time t is defined as inputs to stocks of material m. The dynamic stocks-drive-flows model is applied to estimate the material inflows and outflows during 1978–2018 on a sector scale. The annual outflows are determined from stocks using the lifetime model, and the annual inflows are determined from mass balance with outflows and stocks change (Eq. 5):$$demand=inflow=outflow+stock;change$$The lifetime distribution expresses the probability of each end-use sector to reach the end-of-life at the time t. According to previous studies15,31, we assume a normally distributed lifetime (lambda left(t,t{prime} ,L,sigma right)) ((t{prime} ) = 1949) with end-use sectors dependent mean L and standard deviation σ (Eq. 6), which determines the outflow ({F}_{out}) from stocks and inflows ({F}_{in}) (Eqs. 6–8):$$lambda left(t,t{prime} ,L,sigma right)=frac{1}{sigma sqrt{2pi }}times expleft(frac{-(t-t{prime} -L)}{2{sigma }^{2}}right)$$$${F}_{in}(t)={S}_{left(tright)}-{S}_{left(t-1right)}+{F}_{out}(t)$$$${F}_{out}({rm{t}})=sum _{t{prime} le t}{F}_{in}left(t{prime} right)times lambda left(t,t{prime} ,tau ,sigma right)$$Since material quality requirements are different between buildings, cars, machines, laptops, and other products, the lifetime can vary greatly. However, it is hard to get a specific lifetime of each product in different regions, we assume that the lifetime of products in the same end-use sector keeps unchanged. The mean lifetime and standard deviation for each end-use sector are given in Table 1. According to Eqs. (6–8), when the net stocks (({S}_{left(tright)}-{S}_{left(t-1right)})) less than zero, the ({F}_{in}(t)) will be negative. Hence, to elaborate the negative data of inflow, we will artificially set ({F}_{in}(t)) into zero. The ({F}_{ou
https://www.nature.com/articles/s41597-021-01075-7
China material stocks and flows account for 1978–2018