LST differences
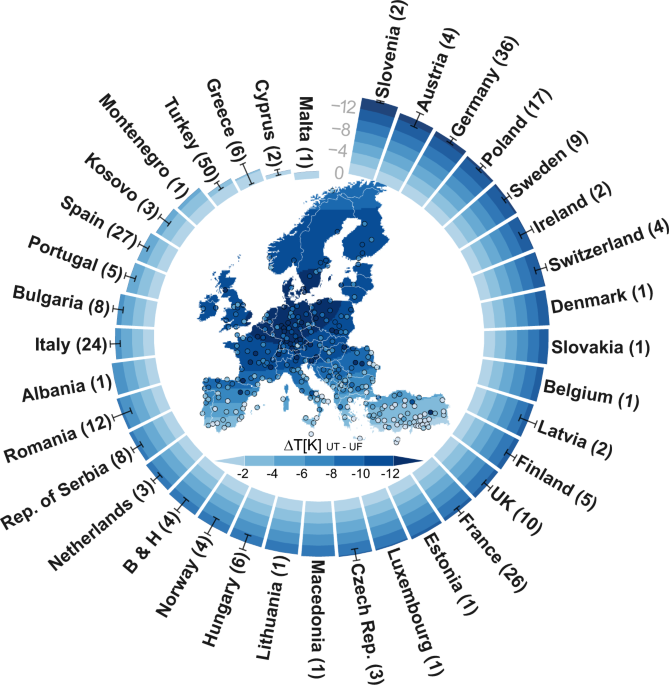
During hot temperature extremes, the results indicate a clear difference in LSTs between areas of continuous urban fabric and areas covered by urban trees (Fig. 1). Urban trees are found to have lower temperatures than urban fabric in all analysed European cities with the exception of a few cities in southern Turkey, the Mediterranean and the Iberian Peninsula (e.g. Gaziantep, Fig. 2c). The LST difference is especially high in cities in Central Europe, including the regions of France, Alps/Mid-Europe, British Isles and Eastern Europe, (−12 to −8 K) but lower in the Mediterranean, Turkey and the Iberian Peninsula (−4 to 0 K).
Fig. 1: Regional variation in temperature differences (∆T) during hot extremes between areas covered 100% by urban trees (UT) and areas covered 100% by continuous urban fabric (UF). The map shows smoothed spatial trends of the temperature differences, and each dot represents the temperature difference in a specific city. Mean temperature differences for each country are indicated by stacked bars, and standard errors of the mean are also shown. The number of cities that could be used to calculate mean values in each country are indicated in brackets after the country name. B & H stands for the country Bosnia and Herzegovina. Full size image
Fig. 2: Temperature differences between urban trees and continuous urban fabric for selected cities in Europe. a All cities together with their surroundings that were selected for analysis (grey) and cities for which results are shown in more detail (red). In each region, a representative city was selected (except for Turkey, where we show the results for two cities). b Geographic extent of the defined European regions. c The LST differences between continuous urban fabric and areas covered 100% by urban trees (UT urban trees, UF continuous urban fabric). Boxplots of each city indicate the spread of temperature differences calculated for all summertime (JJA) observations (boxes show the first and third quartile; whiskers show the largest/smallest values, but do not extend beyond 1.5 times of the interquartile range; outliers are shown as separate points). The temperature difference observed when the background temperature was highest is shown as an orange dot together with error bars denoting standard errors. Full size image
The median summertime temperature difference between urban trees and urban fabric is not always consistent with the temperature difference during hot extremes (Fig. 2c and Supplementary Fig. 1). For instance, the temperature differences during hot extremes in Turkey, the Mediterranean, the Iberian Peninsula, France and Eastern Europe are lower than during average summertime conditions, indicating that the cooling provided by trees decreases during hot extremes in these regions. In contrast, in Scandinavia, the British Isles and parts of the Alps/Mid-Europe, the cooling provided during hot extremes is at times even higher than median summertime cooling. The highest cooling is observed to move further north during hot extremes in comparison to average summertime conditions (Supplementary Fig. 17).
The cooling during different seasons also shows a clear regional pattern (Fig. 2c). In Southern European and Turkish cities such as Gaziantep (Turkey), Cordoba (Spain) and Antalya (Turkey), the cooling during spring (March/April/May) is higher than or very close to the cooling during summer (June/July/August). In European cities in all other regions (cf. Fig. 2c), the cooling is highest during summer. The cooling during autumn (September/October/November) is lowest in all cities and regions in comparison to the cooling in summer and spring.
The temperature differences between rural forests and continuous urban fabric closely resemble the temperature differences between urban trees and urban fabric (Fig. 3, Supplementary Fig. 2, and Supplementary Fig. 3). However, there are some notable distinctions. Urban trees reduce LSTs more than rural forests in Central European regions. In contrast, in Turkey, the reduction in the LSTs of rural forests is larger than that of urban trees. The temperature differences between rural forests and urban fabric (∆T F-UF ) show an east–west gradient, with the absolute ∆T F-UF in Eastern Europe being lower than the temperature differences in Western Europe. Absolute temperature differences between treeless green spaces and urban fabric (∆T GS-UF ) are smaller than the temperature differences between urban trees and urban fabric (∆T UT-UF ) in all European regions (Supplementary Fig. 1a). Similarly, the absolute temperature differences between rural pastures and urban fabric (∆T P-UF ) are much smaller than the ones between rural forests and urban fabric (Supplementary Fig. 1b). Green spaces and pastures are often warmer than urban fabric in Southern European regions and particularly in Turkey. The temperature differences between urban trees and green spaces (∆T UT-GS ) and rural forests and pastures (∆T F-P ) show a less clear regional pattern and differ from each other. ∆T UT-GS is slightly higher in Central European regions than in Southern European regions, whereas ∆T F-P is highest in the Mediterranean and Turkey. ET and albedo also show distinct regional patterns. ET in Southern European regions (particularly in the Iberian Peninsula and Turkey) over forests and pastures is much lower than in most central European regions (Supplementary Fig. 5). The albedo of urban areas is highest in southern European regions (particularly in the regions Mediterranean and Turkey) and lowest over Scandinavia (Supplementary Figs. 4 and 19). The variation in the albedo of forest areas is relatively small in comparison to the variation in the albedo of urban areas (Supplementary Figs. 4 and 19). This is why the regional differences in albedo between urban and forested areas are consistent with the regional variation in the albedo of urban areas. The inter-city spatial variation in ∆T UT-UF in Europe is correlated with the spatial variation in ET over rural forest areas (Fig. 4a). The inter-city variation in ∆T GS-UF in Europe is correlated with the spatial variation in ET over rural pastures (Fig. 4b). In contrast, the inter-city correlation between ∆T UT-UF and the albedo difference between forested and urban areas (α F-U ) is very small, and the inter-city variance of ∆T UT-UF can hardly be explained by albedo differences (R2 < 0.1).
Fig. 3: Temperature differences between urban or rural vegetation and urban fabric. a Temperature differences between urban vegetation and urban fabric. b Temperature differences between rural vegetation and urban fabric (boxes show the first and third quartile; whiskers show the largest/smallest values but do not extend beyond 1.5 times of the interquartile range; outliers are shown as separate points). Full size image
Fig. 4: Mean summertime temperature differences (∆T) between urban vegetated areas and continuous urban fabric plotted against evapotranspiration of vegetated areas outside of each city. a Scatterplot of temperature differences between urban trees (UT) and urban fabric (UF) plotted against evapotranspiration (ET) estimated for rural forests. b Scatterplot of temperature differences between treeless urban green spaces (GS) and urban fabric (UF) plotted against evapotranspiration estimated for rural pastures. Each dot represents a city. All cities in a specific region have the same colour. Full size image
Urban trees for mitigating urban heat in Europe
Based on observations for a large number of cities in different climates, we compare temperatures over areas of urban trees, treeless urban green spaces, rural forests, rural pastures and continuous urban fabric. The results show that the local cooling of urban trees in comparison to urban fabric varies with background climate. The absolute LST differences between urban fabric and urban trees are the largest in Central Europe pointing towards a high cooling potential. The absolute temperature differences between urban trees and urban green spaces (∆T UT-GS ) are generally much lower than the LST differences between urban trees and urban fabric. However, in several cities in Southern Europe (in the Iberian Peninsula, the Mediterranean and Turkey), the absolute value of ∆T UT-GS is small and may even be larger than the absolute difference between urban trees and urban fabric. Hence, it can be argued that it is crucial to equip green spaces with more trees, particularly in these cities and regions. In Scandinavia and over the British Isles, treeless urban green spaces and urban trees provide for substantial cooling. However, while our analysis based on remote-sensing data shows clear spatial patterns in the LST reduction provided by different vegetation types, it is essential to note that the benefits of trees and green spaces are manifold. For example, pedestrian thermal comfort can substantially vary if the effects of trees on shading, wind speed and humidity are taken into account12,20,29.
Our results show that the average LST differences between vegetated and urban land can diverge from LST differences during hot extremes. Depending on the region, the differences during hot extremes can be either larger or smaller than those during average summertime conditions. These findings suggest that temporally averaging LST observations before deriving the impacts of vegetation on temperature may obscure the cooling potential during times it is most important (i.e. during hot extremes). Determining whether high cooling during a short hot period is more relevant than high cooling during longer less extreme periods, therefore, becomes a pertinent component of mitigating the adverse effects of urban heat. In particular, this could be relevant when comparing different heat mitigation strategies that may also have a greater or lesser effect during hot extremes.
The cooling potential of urban trees decreases during hot extremes in many cities, in particular in Southern and South-eastern European regions. Projected drying in European summers in these regions is likely to further reduce vegetation benefits30. However, drying may not only occur in Southern Europe but in many European regions30. Hence, we may see a decrease in cooling even in regions where we presently see the highest cooling. Irrigation could help to maintain the high cooling provided by vegetation in these regions but may be limited by future water scarcity. This sheds light on additional heat mitigation measures (e.g. increasing the albedo of roofs and pavements) and shows how difficult it is to compare the effect of different measures for varying environmental conditions.
Biophysical processes related to observed cooling patterns and differences between urban and rural vegetation
The temperature differences between urban trees and continuous urban fabric are correlated with the temperature differences between continuous urban fabric and rural forests (Supplementary Fig. 2) and show very similar regional variations (Fig. 3). This close correlation indicates that the cooling provided by urban trees and rural forests in a specific region is guided by similar processes and environmental conditions. In particular, the spatial patterns of temperature differences between urban trees/rural forest and continuous urban fabric are closely linked to the level of ET associated with forests in different regions. Similarly, the spatial patterns of temperature differences between treeless urban green spaces/rural pastures and urban fabric are quite closely correlated with ET over pastures in the surrounding of each city. ET over vegetated areas explains a large part of the variation in LST differences.
The variation in environmental conditions along urban-to-rural gradients, which can be very important8, has according to our results a much smaller impact on the variation in cooling than the variation in environmental conditions across regions. However, several differences between rural and urban vegetation cooling are noteworthy (Fig. 3). The cooling of urban trees in Central European regions and, particularly in Scandinavia, is higher than that of rural forests. This could indicate that factors potentially contributing to a higher transpiration and cooling rate in cities (e.g. higher background temperatures) outweigh factors that may reduce cooling in cities (e.g. increasing water stress due to insufficient soil volumes). In Turkey, the cooling of urban trees is generally much lower than that provided by rural forests and hence factors reducing the cooling of urban trees in cities may dominate in this region. On the other hand, the cooling of treeless green spaces in Turkey is higher than that of rural pastures. This could indicate that irrigation of treeless urban green spaces is more relevant than irrigation of urban trees in Southern European regions, including Turkey. Irrigation may, indeed, play a relatively small role for urban trees in Europe31,32. However, such aspects need further investigation, and it still is very difficult to derive a clear picture of urban vs. rural vegetation temperature and transpiration differences. To further validate and elucidate the urban vs. rural differences in cooling provided by vegetation, it will be crucial to generate high spatial resolution data on the biophysical processes within cities including e.g. estimates of sensible and latent heat fluxes33.
The lowest temperature differences between urban trees and urban fabric are observed in cities in Southern European regions and are related to low ET rates (Fig. 4), which can be linked to increased surface resistance due to limited soil moisture availability18,34. High temperatures during summertime in the Mediterranean and during hot extremes have the potential to increase ET through the high VPD16,18. However, transpirational cooling of trees often decreases considerably due to reduced stomatal conductance35. Certain tree species keep their stomata open even during hot extremes, possibly to create a cooling effect through transpiration36. Hence, there are regions in which trees show an increase in transpiration during hot extremes37. The species-specific response to high temperatures and drought conditions38 overlays the effect of environmental conditions (e.g. amount of soil moisture) in ways that are not directly captured in the MODIS ET product used in this study and cannot easily be disentangled. Since the cooling of urban trees during hot extremes shifts north and increases
https://www.nature.com/articles/s41467-021-26768-w