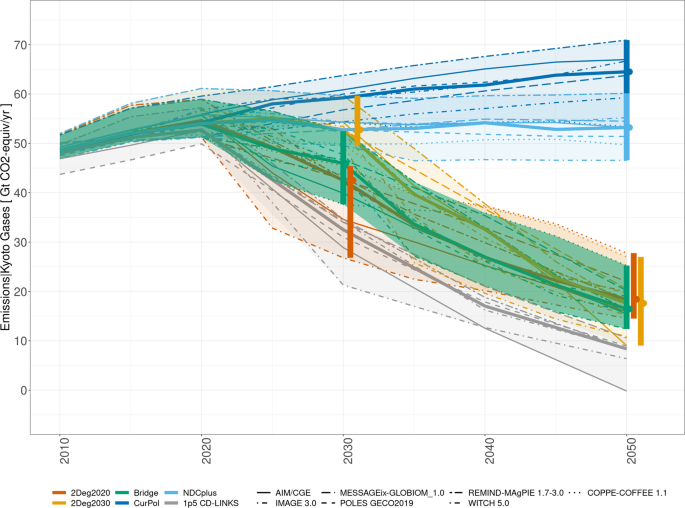
Global roll-out of comprehensive policy measures may aid in bridging emissions gap Heleen L. van Soest orcid.org/0000-0001-5307-58801,2, Lara Aleluia Reis orcid.org/0000-0002-6676-70073, Luiz Bernardo Baptista orcid.org/0000-0002-7016-17964, Christoph Bertram orcid.org/0000-0002-0933-43955, Jacques Després orcid.org/0000-0002-9851-99646, Laurent Drouet orcid.org/0000-0002-4087-76623, Michel den Elzen orcid.org/0000-0002-5128-81501,7, Panagiotis Fragkos8, Oliver Fricko orcid.org/0000-0002-6835-98839, Shinichiro Fujimori orcid.org/0000-0001-7897-17969,10,11, Neil Grant orcid.org/0000-0001-8671-501212, Mathijs Harmsen orcid.org/0000-0001-6755-15691,2, Gokul Iyer orcid.org/0000-0002-3565-752613, Kimon Keramidas6, Alexandre C. Köberle orcid.org/0000-0003-0328-475012, Elmar Kriegler orcid.org/0000-0002-3307-26475,14, Aman Malik orcid.org/0000-0002-7310-84485, Shivika Mittal orcid.org/0000-0003-4718-006412, Ken Oshiro orcid.org/0000-0001-6720-409X10, Keywan Riahi orcid.org/0000-0001-7193-34989, Mark Roelfsema1,2, Bas van Ruijven orcid.org/0000-0003-1232-58929, Roberto Schaeffer orcid.org/0000-0002-3709-73234, Diego Silva Herran orcid.org/0000-0001-5484-444211,15, Massimo Tavoni3,16, Gamze Unlu orcid.org/0000-0003-0080-71229, Toon Vandyck orcid.org/0000-0001-5927-03106 & Detlef P. van Vuuren orcid.org/0000-0003-0398-28311,2 Nature Communications 12, Article number: 6419 (2021) Cite this article Climate-change mitigationClimate-change policy Closing the emissions gap between Nationally Determined Contributions (NDCs) and the global emissions levels needed to achieve the Paris Agreement’s climate goals will require a comprehensive package of policy measures. National and sectoral policies can help fill the gap, but success stories in one country cannot be automatically replicated in other countries. They need to be adapted to the local context. Here, we develop a new Bridge scenario based on nationally relevant, short-term measures informed by interactions with country experts. These good practice policies are rolled out globally between now and 2030 and combined with carbon pricing thereafter. We implement this scenario with an ensemble of global integrated assessment models. We show that the Bridge scenario closes two-thirds of the emissions gap between NDC and 2 °C scenarios by 2030 and enables a pathway in line with the 2 °C goal when combined with the necessary long-term changes, i.e. more comprehensive pricing measures after 2030. The Bridge scenario leads to a scale-up of renewable energy (reaching 52%–88% of global electricity supply by 2050), electrification of end-uses, efficiency improvements in energy demand sectors, and enhanced afforestation and reforestation. Our analysis suggests that early action via good-practice policies is less costly than a delay in global climate cooperation. In the Paris Agreement, countries agreed to limit global warming to well below 2 °C, and preferably 1.5 °C1. For implementation, the Paris Agreement relies on mitigation action at the national level. These actions are communicated via nationally determined contributions (NDCs) and long-term strategies, containing each country’s pledged contribution to global mitigation. A key question is whether the collective action of all countries leads to the implementation of the Paris Agreement’s climate goals2,3. For this, countries agreed on a global stocktake process to periodically review collective progress and, if needed, stimulate additional efforts to meet the Paris Agreement’s global climate mitigation goals.Several publications have already shown that the aggregated impact of NDCs is insufficient4,5. In addition, global emissions implied by nationally implemented policies are, collectively, even exceeding the global emissions levels projected under current NDCs4. This means that current NDCs and policies need to be strengthened. Scenarios from global integrated assessment models (IAMs) can provide guidance on how to do this. These include scenarios that provide information on how to implement reductions cost-optimally. However, in reality, it is not always possible to implement the measures included in these cost-optimal pathways6. For instance, influential societal actors might be able to block certain measures if they go against their interests. Market distortions can also make certain measures unattractive. Other solutions might lack societal support (e.g., carbon capture and storage), and also the rate at which a transition can be implemented may be slowed down (e.g., in the case of closing coal mines given the impact on coal miners and coal-dependent regions and communities). At the same time, however, there is also evidence of effective implementation of climate policies7. Here, good practice policies are defined as successfully implemented policies in one or more countries with a noticeable impact on greenhouse gas (GHG) emissions. In some cases, these policies are not even part of the cost-optimal mix suggested by models but could be easier to implement. It has been suggested that scaling up these good practice policies to other parts of the world might in the short-term be a more feasible and convincing strategy8,9,10,11,12,13.First of all, history has shown that costs are only one factor influencing policy choices (see, e.g., Trutnevyte14, and the example of investments in renewable energy in the period that costs were still high). Other factors that influence policy choices include societal support, the influence of specific actors, and possible (perceived) co-benefits and trade-offs, including impacts on competitiveness. Second, such good practice policies have already been implemented in some countries, showing their effectiveness, at least in some places. Third, earlier work15 suggests that strengthening administrative and firm capabilities involved with monitoring, reporting and verification of emissions to support trading systems requires time and effort. Literature on policy sequencing16,17 shows how policies go through stages and at some point gain enough traction, experience, and political momentum to eventually move to efficient carbon pricing.Fekete et al.7, Roelfsema et al.8, and Kriegler et al.9 investigated the impact of replicating such good practice policies in other parts of the world by focusing on global GHG emissions and indicators related to implementability (such as maximum annual average emissions reduction rate, carbon price increase per decade, or cumulative CCS deployment). Although helpful as a first step, this earlier work is limited by 1) the formulation of good practice policies at the global scale and 2) being based on a limited number of models. Better information on such good practice policies is needed to support the UNFCCC global stocktake in 2023.Here, we build on the earlier work7,8,9, also going beyond relatively abstract cost-optimal pathways as guidance for policy-making by focusing on concrete policy measures that can be implemented to close the emissions gap. We do this for the first time using multiple models (both global and national) to assess a common set of reduction measures. These measures have been defined in consultation with national experts, making the scenarios more relevant (see Methods for details). The key scenario is referred to as the Bridge scenario, as it aims to bridge the gap between the ambition levels set out by countries by 2030 and those consistent with limiting global warming to 2 °C. This scenario includes a set of well-defined measures that can be implemented in the 2020–2030 period and go beyond the ambition of the NDCs (good practice policies), and that would still allow reaching the Paris climate goals by transitioning to a cost-optimal path towards 2 °C after 2030 (see Methods), assuming that governments prepare the ground for comprehensive (pricing) measures that are socially acceptable, e.g. through the use of revenues18. A focus on successfully implemented policies, as done in the Bridge scenario, will likely have near-term advantages in terms of political feasibility compared to an approach that focuses solely on cost-effectiveness (see above). The Bridge scenario, for example, allows to follow the steps identified in work on policy sequencing and thus move more smoothly than scenarios focusing on cost-effectiveness. The sequencing of policies can be attractive for other reasons as well. This allows, for instance, a gradual phase-in of climate policy per sector, e.g., to give households time to adjust. This concern applies particularly to investments related to residential energy use, where the lifetime of infrastructure typically extends beyond a few years. Additionally, the policy package that we apply is regionally differentiated, with higher-income countries taking more significant action in the 2020s. This can address some of the feasibility concerns observed in cost-optimal scenarios, allocating mitigation efforts to low-income countries in the near term (given the high potential for low-cost options, but with considerable feasibility concerns). We show that the Bridge scenario closes two-thirds of the emissions gap between NDC and 2 °C scenarios by 2030 and enables a pathway in line with the 2 °C goal when combined with more comprehensive pricing measures after 2030. Our analysis suggests that early action via these good-practice policies is less costly than a delay in global climate cooperation.In order to discuss the possible impacts of the Bridge scenario, we compare it to four other scenarios, i.e., the impacts of current policies (CurPol), the conditional NDCs (NDCplus), and the models’ cost-optimal pathways towards 2 °C (starting immediately: 2Deg2020, and with a delay: 2Deg2030) (see Methods and Supplementary Information for more details). For the first two scenarios, the current policies and NDCs were extended beyond 2030 by assuming equivalent effort, i.e., by extrapolating the equivalent carbon price in 2030, using the GDP growth rate of the different regions up to 2050 for the extrapolation (see Supplementary Methods). For the Bridge scenario, the defined set of measures was implemented up to 2030 (Table 1) and a cost-optimal path towards 2 °C was implemented after 2030 (see Supplementary Methods). A full description of the scenarios and additional results can be found in the Supplementary Information. In the context of the global stocktake, here we focus on the results at the global level and several large countries, while more detailed national-level results by national models can be found elsewhere11.Table 1 The good practice policies that were assumed to be replicated globally in the Bridge scenario, with differentiated targets for high-income and low-/medium-income countries, adapted from earlier analysis of good practice policies7,8,9.A bridge over the emissions gapThe model outcomes (Fig. 1 and Supplementary Figs. 8 and 9) show that the CurPol and NDCplus scenarios both fall considerably short of the emission reductions needed to limit global warming to 2 °C (consistent with earlier work). In contrast, the good practice policies included in the Bridge scenario can reduce GHG emissions close to the needed levels in 2030, followed by a longer-term trajectory similar to the ambitious benchmark of 2Deg2020. The Bridge scenario has a less steep reduction than the 2Deg2030 scenario in the 2030s, offering a pathway that largely closes the 2030 emissions gap without adding substantial challenges in the 2030s and 2050s. The emissions gap is defined as the difference between the NDCplus scenario and the 2Deg2020 scenario (median: 11.8 GtCO2eq). The Bridge scenario closes that global emissions gap by 7.2 GtCO2eq or 60% (median, range 26–275%) by 2030 and compensates the slower start by a slightly deeper emission reduction in 2050, 106% (92–112%). Some recently submitted NDCs could not be considered as they came after the cut-off date of this work. Based on the Synthesis report by the UNFCCC19, global emissions levels under the NDCs would be 398 Mt CO2eq lower in 2030 when taking these into account (i.e., 3.4% of the median emissions gap found here and 5.5% of the 2030 emissions reductions under the Bridge scenario). Compared to a 1.5 °C scenario instead of 2Deg2020 (1.5 °C scenarios were not run here but included from the CD-LINKS project4 for comparison), the global emissions gap would be closed by 31% (21–57%) by 2030 and by 81% (71–85%) by 2050. The difference in 2030 emissions between the NDCplus and 2Deg2020 is closed by 16% in the USA, 49% in India, 56% in the EU and 68% in China.Fig. 1: Global GHG emissions (Gt CO2eq/year) between 2010 and 2050, as projected by the global models.Vertical bars: model range in 2050. Circles: model median in 2050. Thick solid lines: median. Grey: 1.5 °C scenarios from the IPCC SR1.5 database are included for comparison (a selection was made to cover the same models as represented here, with most similar scenario set-up, i.e., the 1.5 °C scenarios developed in the CD-LINKS project4). Projections for the Bridge scenario without the carbon tax measure are shown in Supplementary Fig. 7, for NDCplus variant NDC_2050convergence in Supplementary Fig. 8, and for 2050—2100 in Supplementary Fig. 9.Supplementary Fig. 1 shows the national rates of GHG emissions reductions in the Bridge scenario, compared to the CurPol, NDCplus, and cost-optimal cases (immediate: 2Deg2020 and delay: 2Deg2030). In contrast to the increase in GHG emissions under current policies in some
https://www.nature.com/articles/s41467-021-26595-z
Global roll-out of comprehensive policy measures may aid in bridging emissions gap